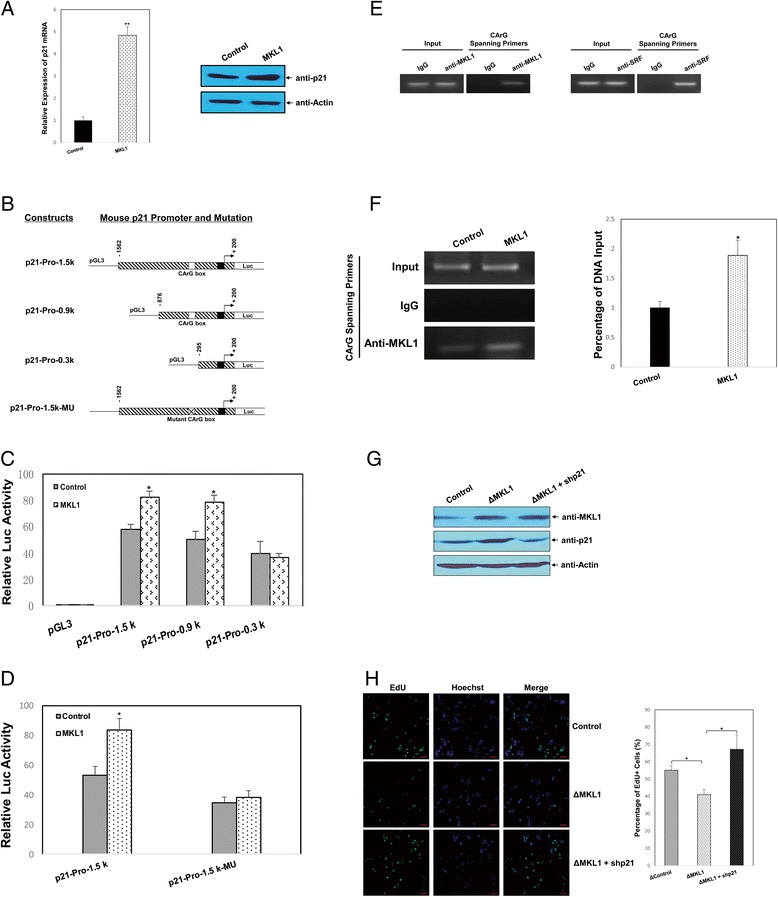
Figure 4.

MKL1 induces p21 expression. A) The expression of p21 was examined by qPCR and western blotting in MKL1-overexpressing MPC5 cells. GAPDH and actin were used to normalize p21 levels. **p < 0.01 compared with the control (unpaired Student’s t-test). B) Sequential deletions and mutations of the mouse p21 promoter were fused to a luciferase reporter. MPC5 cells in 24-well plates were co-transfected with the MKL1 expression plasmid (1 μg/well) and various wild-type C) or mutant D) p21 promoter luciferase reporters (1 μg/well). The luciferase activity of the extracts was determined at 24 h after transfection using a Betascope analyzer. Luciferase values were normalized to Renilla activities. *p < 0.05 compared with the empty vector (unpaired Student’s t-test). E) ChIP assays were performed using an anti-MKL1 antibody, anti-SRF antibody, or control IgG in MPC5 cells. The association of MKL1 or SRF with the proximal mouse p21 promoter was analyzed by PCR. The amount of input was confirmed by equal loading of chromatin. F) ChIP assays were performed using the anti-MKL1 antibody or control IgG in MKL1-overexpressing MPC5 cells. The association of MKL1 with the proximal mouse p21 promoter was analyzed by PCR or qPCR. The amount of input DNA was confirmed by equal loading of chromatin. *p < 0.05 compared with the empty vector (unpaired Student’s t-test). G) ΔMKL1 cells were transiently transfected with a p21-specific shRNA plasmid (shp21) and cultured at 33°C. The efficiency of p21 knockdown was examined by western blotting. Actin was used to normalize MKL1 and p21 levels. H) Cell proliferation was measured by immunofluorescence analysis of EdU incorporation. Scale bars, 25 μm. The percentage of proliferating cells was calculated as EdU-positive cells/Hoechst-stained cells × 100%. *p < 0.05 compared with the control (one-way ANOVA followed by Tukey’s HSD test).
