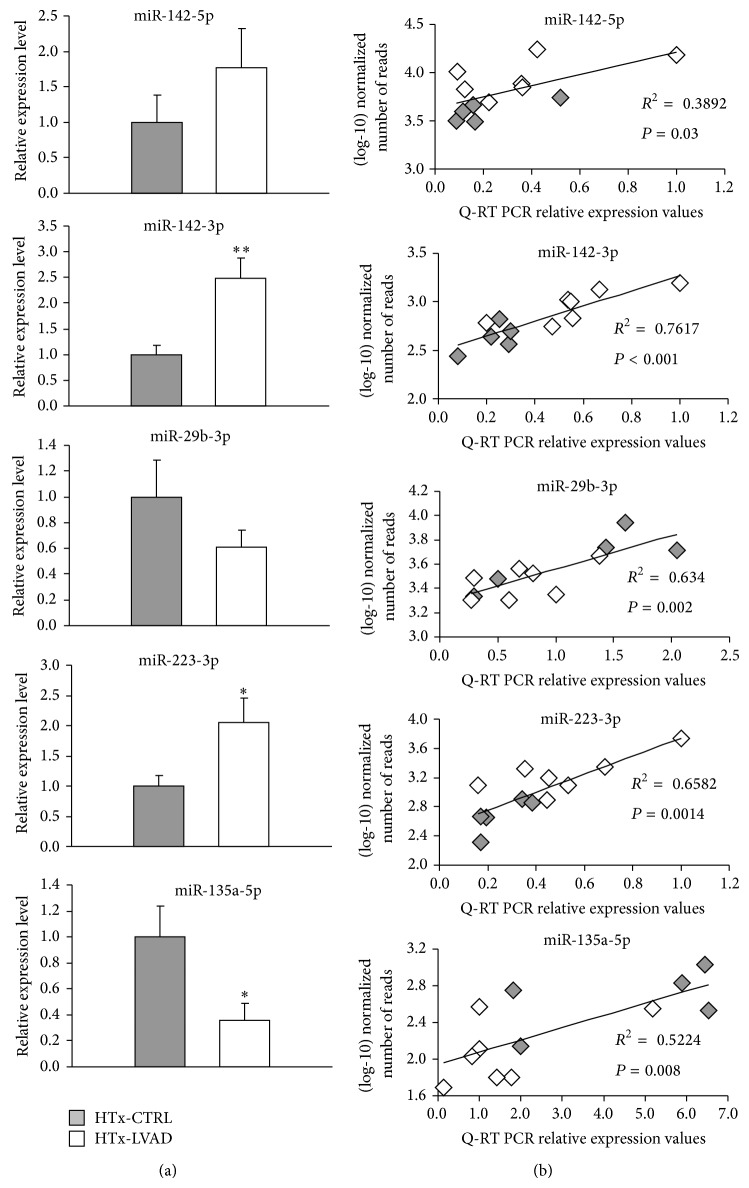
Figure 3.
Validation by Q-RT PCR and correlation with next generation sequencing data. (a) Mean Q-RT PCR normalized expression values of selected microRNAs in a subset of HTx-CTRL (n = 5, grey bars) and HTx-LVAD (n = 7, white bars) heart samples (* P < 0.05; ** P < 0.01). (b) Correlation analyses between (log10)-transformed number of miRNA read counts and Q-RT PCR relative expression values. Grey and white symbols are representative of HTx-CTRL and HTx-LVAD data pairs, respectively.

