
Fig. 2. Heterogeneous eribulin uptake and toxicity across human cancer cell lines.
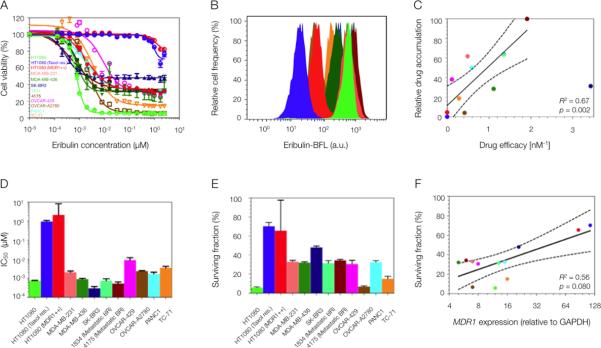
(A and B) Variable eribulin (unlabeled parent compound) cytotoxicity (A) and eribulin-BFL uptake (B) profiles across a human cell line panel, including breast (MDA-MB-231, MDA-MB-436, SK-BR3, 1834, 4175), ovarian (OVCAR-429 and A2780), pancreatic (PANC1), Ewing's scaroma (TC-71) and fibrosarcoma (HT1080: wild type, taxol resistant, and MDR1-expressing). Two human breast cancer lines were derived from metastases to the lung, 1834 and 4175. (C) Linear regression of eribulin-BFL accumulation (min-max normalized) and unlabeled eribulin efficacy, here defined as the inverse of its cellular IC50. Solid lines represent regression best-fit lines and dotted lines represent associated 95% confidence bands. Each data point represents the average of triplicate experiments; where mean drug accumulation was analyzed in 10,000 cells per experiment. (D and E) Heterogeneity in half maximal inhibitory concentration, IC50 (D), and in the surviving fraction of cells (E) in response to eribulin treatment. Data are means ± SEM (n=3). (F) Nonlinear regression of MDR1 protein expression and surviving cell fraction. MDR1 protein expression was normalized to GAPDH. Each data point represents the average of triplicate experiments. Solid lines represent regression best-fit lines and dotted lines represent associated 95% confidence bands. P values for the regression analyses in (C and F) were determined by the Student's t distribution.