
Fig. 4. Single cell and population pharmacokinetics of wild type and resistant tumor subpopulations in vivo.
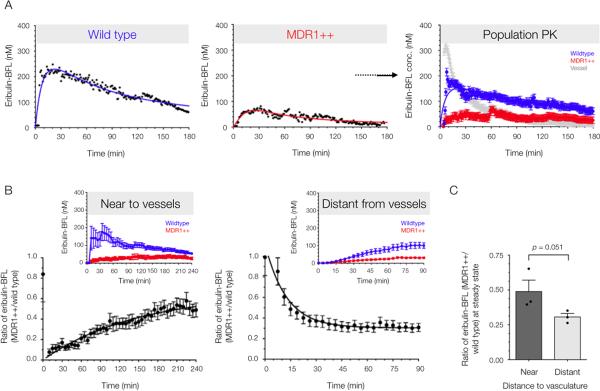
(A) Experimental data and analytical modeling of eribulin-BFL PK in wild-type and resistant (MDR1++) single cells, and in mixed populations of both wild-type and resistant cells. Resistant cells are defined as those fluorescently expressing MDR1-mApple. The vascular concentration shows drug concentration increase and loss within a segmented tumor vessel. Data are means ± SEM (n = 37 cells, trace from 1 mouse) with solid lines representing best-fit curves. Images were analyzed using automated cell segmentation and tracking algorithms. All cells were identified by the histone H2B-iRFP fusion protein, and the resistant subpopulation was identified by MDR1-mApple fluorescence. (B) The relative drug accumulation in resistant cells as compared to their wild type counterparts (ratio of means ± SEM, n = 3 mice) in a highly vascularized tumor, with a vessel in the imaging field and distant from detectable tumor vasculature, as determined by 3-dimensional imaging stack. Population pharmacokinetics near (< 200 μm) and far (> 200 μm) from vessels are displayed in the image insets from representative mice. (C) Relative eribulin-BFL accumulation in MDR1-expressing cells at steady state was quantified by the fit plateau of a one phase association (near to vessels) or decay (far from vessels). Data are mean ratios ± SEM, as well as individual animals (n = 6 independent time lapse z-stacks acquired in three mice). P value determined by a one-tailed t-test assuming equal SD.