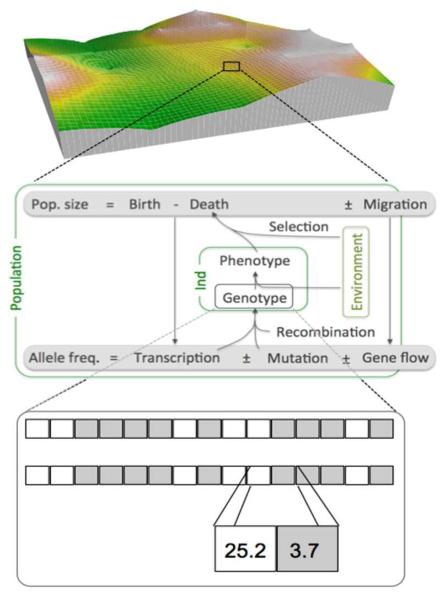
Figure 1.
Structure of the model. Top: Population dynamics take place on a spatially explicit landscape, here for example with a fractal structure of habitat conditions. Middle: Dynamics are followed on the level of both demographic and genetic processes. Recombination and mutation take place during reproduction, the interaction of resulting phenotypes and the environment affect mortality rates and dispersal and migration affect gene flow. Bottom: Individuals carry two copies of a number of loci, which might code for two different traits (indicated by white and grey squares). Allelic values are continuous and are additive within and between loci.

