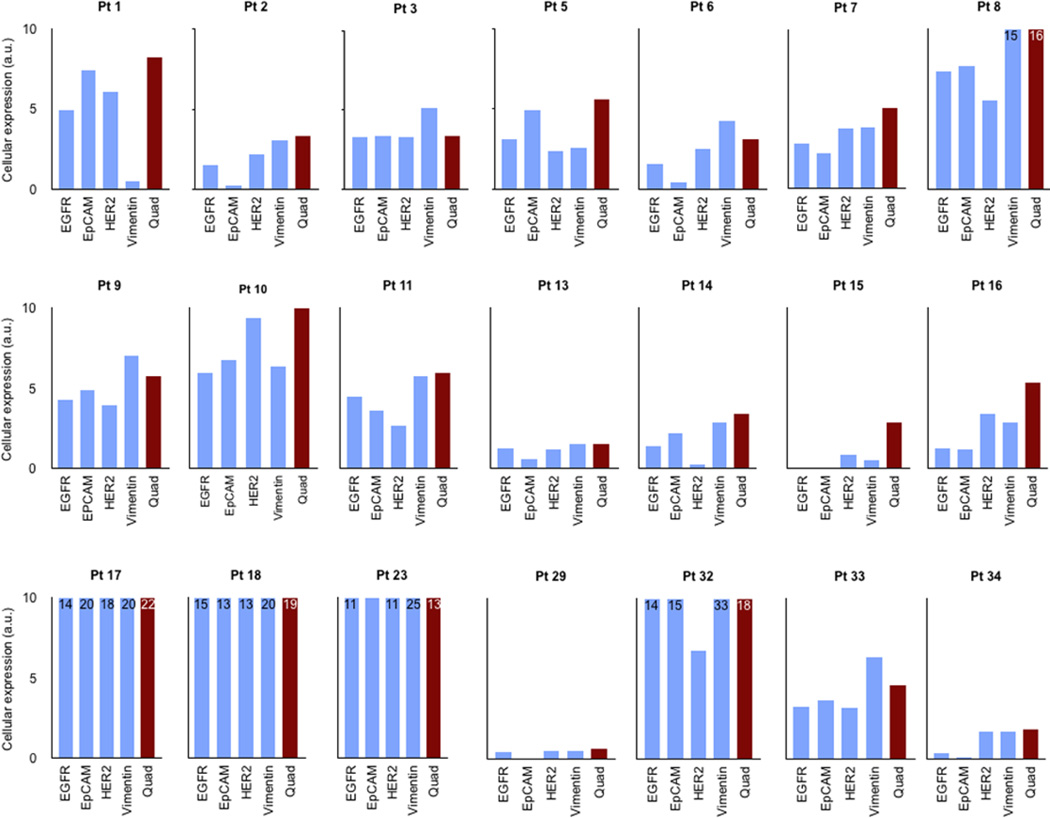
Figure 3.
Detection and characterization of CTC in whole blood. Cellular expression obtained from single and quad-µNMR values are shown in each 21 subjects. Quad-µNMR method (red bars, cocktail of (EGFR, EpCAM, HER-2, MUC-1) were used to detect the presence and abundance of CTC in whole blood. Single µNMR (blue bars) for markers EGFR, EpCAM, HER-2 and vimentin were used for CTC profiling. In each patient, the level of cancer biomarkers are heterogenous in a given patient. Note that cellular expression level obtained from quad-µNMR is higher than that of individual markers.

