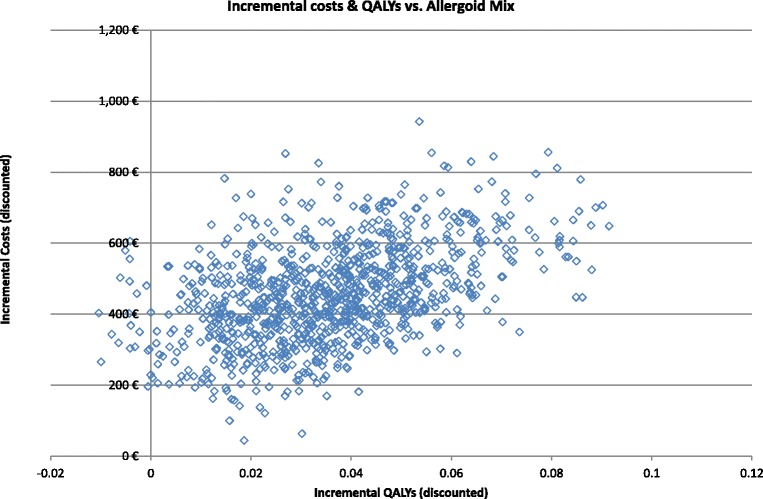
Figure 3.

Scatter plot presenting the incremental costs and incremental QALYs generated in the conducted multivariate sensitivity analyses for the 5-grass tablet vs. allergoid mix.

Scatter plot presenting the incremental costs and incremental QALYs generated in the conducted multivariate sensitivity analyses for the 5-grass tablet vs. allergoid mix.