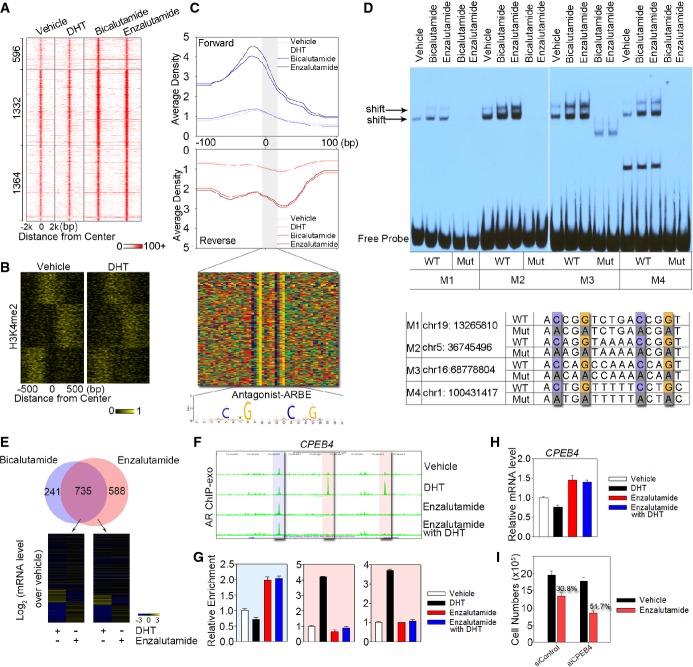
Antagonist can activate AR and provoke biological response through binding to antagonist-liganded ARBE
Heat map showing the signal intensity of AR binding in LNCaP cells treated with DHT, bicalutamide, and enzalutamide, respectively. Numbers indicate the antagonist-responsive AR locations in each category.
Clustering of the antagonist-responsive AR locations based on dynamic signal shifting of H3K4me2 affected by DHT treatment.
The aggregated tag density is shown on the forward (blue) and reverse (red) strands, separately. The bottom panel represents the bound motif sequences found in the antagonist-responsive AR locations. Antagonist-liganded ARBE is also shown.
EMSA was performed to validate specific AR binding to antagonist-liganded ARBEs. Biotin-labeled wild-type (WT) or mutated (Mut) probes were incubated with same amounts of nuclear extract from LNCaP cells treated with bicalutamide or enzalutamide. Arrow indicates the position of the shifted specific probe. Four probes (M1–M4) were randomly selected. Quantification of EMSA gel bands shows that antagonists increase the in vitro binding to 1.7–3.8-fold compared to the vehicle.
Top panel represents overlap between genes within 20 kb of the bicalutamide-responsive AR locations and enzalutamide-responsive AR locations. Bottom panel indicates microarray analysis of genes around enzalutamide-responsive AR locations following treatment with DHT or enzalutamide in LNCaP cells.
UCSC genome browser views of sequencing data at CPEB4 locus under different conditions. The blue region represents antagonist-responsive AR location, while the two pink regions indicate agonist-responsive AR locations.
AR ChIP-exo library validation on antagonist-responsive and agonist-responsive AR locations referred to (F). The data are the mean of triplicates ± SD.
mRNA levels of CPEB4 were examined in cells treated with or without DHT and enzalutamide. The data are the mean of triplicates ± SD.
Silencing of CPEB4 enhanced the inhibitory effects of enzalutamide in LNCaP cells. LNCaP cells were transfected with a control siRNA or siCPEB4. Cells were then treated with vehicle or 1 μM enzalutamide, and cell numbers were determined on day 3 with a direct viable cell count assay. The data are the mean of triplicates ± SD.

