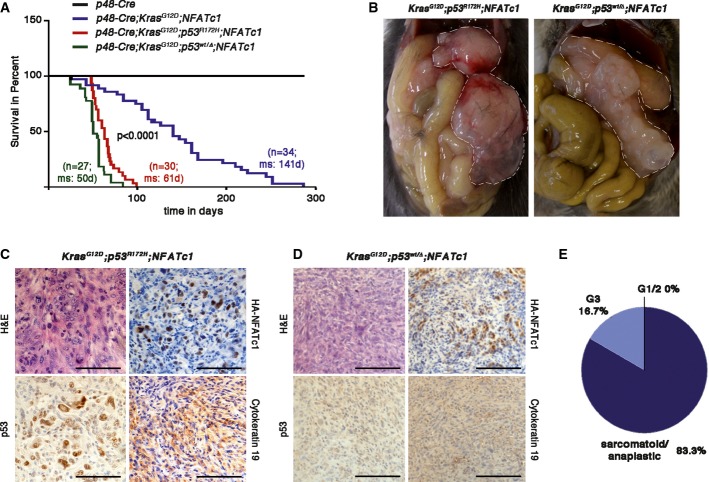
Figure 3.
- Kaplan–Meier curves showing survival of KNC, KPNC, and KPΔNC mice under the control of p48-Cre pancreas-specific promoters (P < 0.0001 for KPNC or KPΔNC cohorts versus KNC, log-rank test, for pairwise combination).
- Pathological features of KPNC and KPΔNC mice before tumor extraction. Pancreatic tissue is encircled.
- H&E and corresponding immunohistochemical stainings of (C) KPNC and (D) KPΔNC mouse tumors. Scale bars, 100 μm.
- Tumor grading of PDAC from KPNC mice (n = 10).

