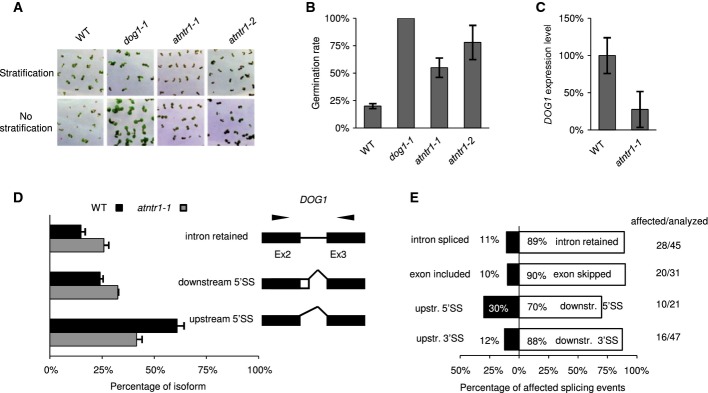
Photographs (A) and quantification (B) of seed dormancy tests. The chart represents the average percentage of germinated seeds without stratification after 4 days of growth in LD. The error bars represent ± SE (n = 3). Tests were performed on freshly harvested seeds, with or without 3 days of stratification growth in LD.
qPCR of DOG1 expression in siliques (16 days after pollination). The graph represents the average ratio of DOG1 to UBC, normalised to Col-0 (WT). The error bars represent ± SE (n = 3).
DOG1 splicing was assessed by RT–PCR combined with capillary electrophoresis. The graph represents the mean relative contribution of the mRNA forms found in the total pool of amplified products. The black and grey bars represent the data for Col-0 and atntr1-1, respectively. The error bars represent ± SD (n = 3). To the right of the charts, the structures of the examined transcripts are shown (black boxes, constitutive exons; white boxes, alternative regions; black lines, introns). The black arrows show the locations of primers. Downstr. and upstr. stand for downstream and upstream splicing event, respectively.
Directionality of splice site selection in atntr1. Splicing was analysed in 14-day-old MS grown plants. For each type of alternative splice event, the black and white boxes show the contributions of opposite direction splicing events. The numbers represent the percentage of splice events supporting the direction of the splice site event change (also shown on horizontal axis). The numbers on the right-hand panel represent the number of affected splicing events versus total number of splicing events analysed. The white bars represent distal 3′ and downstream 5′ splice site selection (3′SS/5′SS), exon skipping (ES) and intron retention (IR), while the black bars represent 5′ and 3′ splice site selection (3′SS/5′SS), exon inclusion (ES) and intron splicing (IR).

