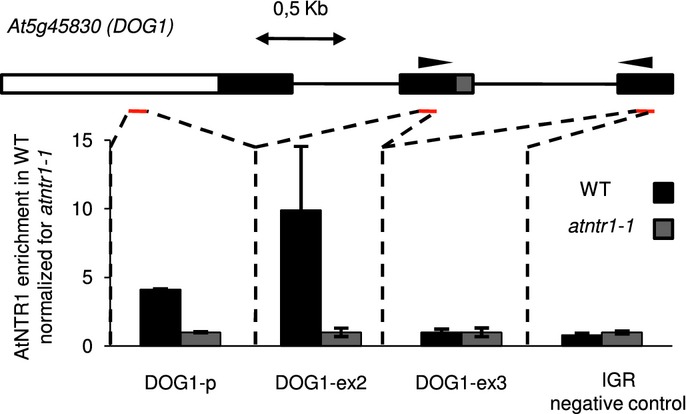
Figure 3.

AtNTR1 is present at the DOG1 gene
AtNTR1 antibodies were used to analyse AtNTR1 protein presence at DOG1 locus using ChIP. Data shown represent enrichment above background level measured in atntr1-1 mutant. Gene structure is shown with black boxes representing constitutive exons; grey box, alternative region; white box, promoter region; black lines, introns. Red lines show amplified regions. 0.5 kb scale is shown. Error bars represent ± SD of three independent experiments. As an additional negative control, primers amplifying an unlinked intergenic region (IGR) were used.
