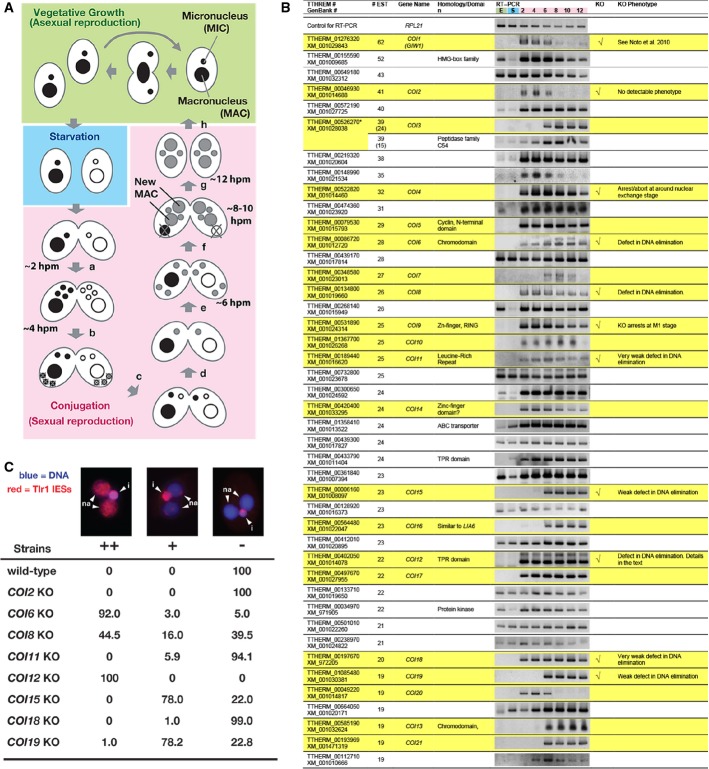
Figure 1.
- Life cycle of Tetrahymena. A single cell of Tetrahymena thermophila contains two different types of nuclei: a macronucleus (MAC) and a micronucleus (MIC). When sufficient nutrients are available, Tetrahymena grows by binary fission, and the MAC and MIC are divided independently (vegetative growth, green). After prolonged starvation (blue), two cells of complementary mating types fuse to begin the sexual reproduction process (conjugation, pink). Their MICs undergo meiosis (a), and one of the meiotic products survives and divides mitotically, giving rise to two pronuclei: one stationary and one migratory (b). The migratory gametic nucleus crosses the conjugation bridge (c) and fuses with the stationary nucleus to produce the zygotic nucleus (d). The zygotic nucleus divides twice (e). Two of the products differentiate into the new MACs, whereas the other two remain as MICs (f). The parental MAC is degraded, and the pair is dissolved (g). The exconjugants resume vegetative growth when nutrients are available (h). The approximate time at which each event occurs in our culture condition is indicated (hpm: hours post-mixing).
- The expression of the predicted Tetrahymena genes showing more than 19 expressed sequence tags (ESTs) from conjugating cells but not vegetative cells was analyzed by RT–PCR using total RNAs from exponentially growing vegetative cells (“E”); 16-h starved cells (“S”); or conjugating cells at 2, 4, 6, 8, 10, and 12 hpm. Twenty-two genes that were exclusively expressed during conjugation are marked with a yellow background. Eleven genes that were analyzed by gene knockout (KO) are indicated in the “KO” column. The phenotypes are described in the “KO phenotype” column. The predicted TTHERM_00526270 contains two genes, which were analyzed separately in this study.
- Exconjugants of wild-type (WT) and KO strains for the indicated COI genes at 36–48 hpm were used to detect Tlr1 IES elements by fluorescence in situ hybridization (FISH). The percentages of total exconjugants that showed severe (++), mild (+), and no (−) DNA elimination defects are given (n > 100). Representative pictures of exconjugants showing each phenotype are shown above. The Tlr1 FISH signal is in red, and the DNA was stained with DAPI (blue). The MICs (i) and the new MACs (na) are marked.

