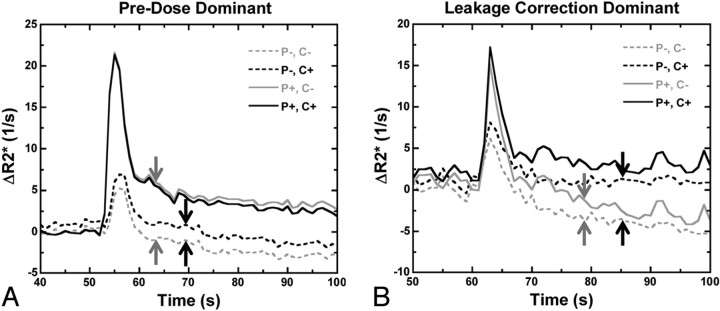
Fig 3.
Comparison of preload-dominant and postprocessing-dominant corrective effects on relaxivity time curves for 2 different tumors. A, Preload alone (solid gray line) eliminates most of the T1 leakage contamination (dashed gray line with blunted peak relaxivity and negative ΔR2* values; shift between gray arrows), whereas postprocessing correction does not (dashed black line; shift between black arrows). B, Postprocessing algorithm has more substantial corrective effect than preload in the tail portion of the curves (dashed black versus dashed gray lines; shift between black versus gray arrows), but the converse is true during the first pass (solid versus dashed lines), demonstrating synergy between the 2 correction schemes. Combining preload and postprocessing (solid black lines) yields the greatest peak ΔR2* without negative relaxivity values.

