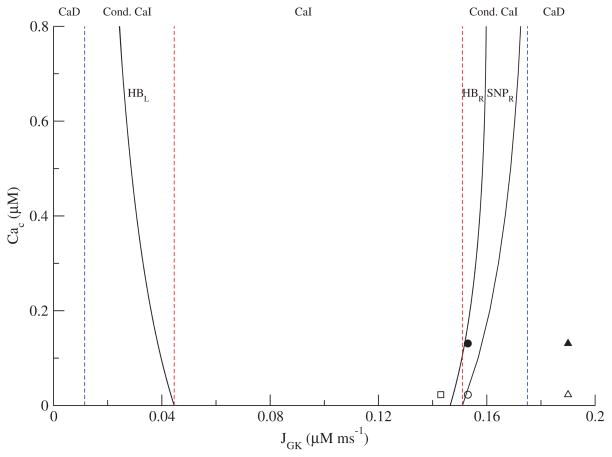
Figure 4.
Two-parameter bifurcation diagram of the glycolytic subsystem illustrating the region of Ca2+ independent (CaI) oscillations. The open square corresponds to Figure 2A after the addition of Dz, the open circle corresponds to Figure 3A, and the open triangle corresponds to Figure 3B. The filled circle corresponds to Figure 3A after KCl is raised to restore oscillations, and the closed triangle corresponds to Figure 3B. The left set of vertical dashed lines are the leftmost (blue) and rightmost (red) JGK values of the HBL curve, while the right set of vertical dashed lines are the leftmost (red) and rightmost (blue) JGK values of the SNPR curve.

