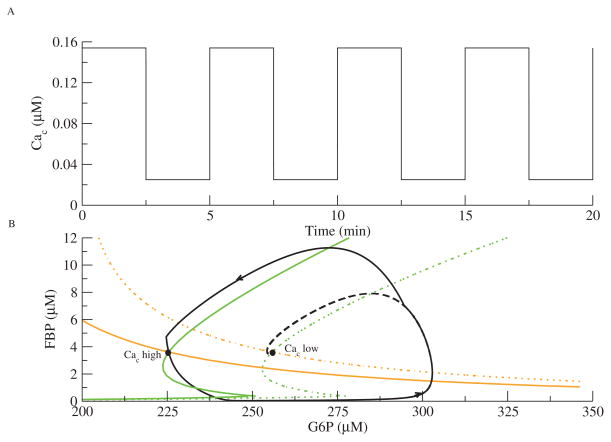
Figure 5.
Forcing of the glycolytic subsystem with JGK = 0.19 μM ms−1. (A) Cac is a square-wave oscillation. (B) The phase plane for the GO. The GO chases two different steady states that switch as Cac jumps from high to low. The FBP (green) and G6P (orange) nullclines move to the left as Cac increases. The trajectory is solid black; the dashed black line indicates that the phase point would have gone to the low Cac steady state if Cac had not jumped.

