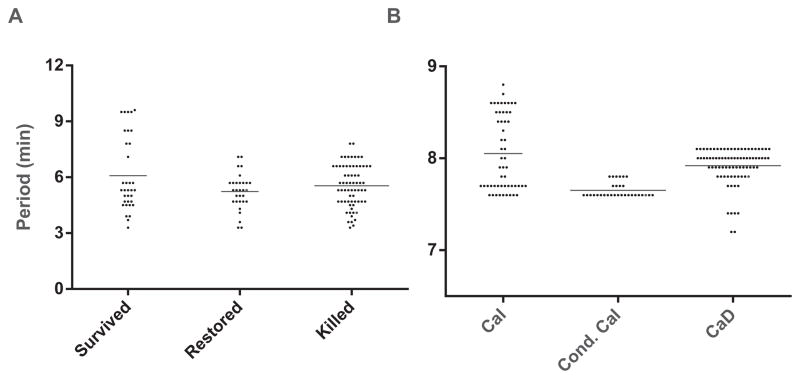
Figure 9.
Periods observed in islets [42] (A) and synthetic data for the reduced DOM (B). Synthetic data generated by taking a Gaussian distribution of JGK values with mean 0.1575 and standard deviation 0.0475. The horizontal lines represent mean values.

