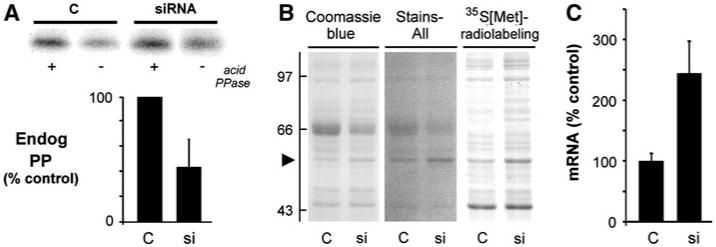
Fig. 5.

Reduction in endogenous CSQ2 phosphorylation in cells treated with CK2 siRNA. COS cells were treated with Ad.CSQ for 24 h in culture, then transfected with siRNA against CK2α plus CK2α′ for an additional 48 h. a Cells were extracted in detergent, and levels of phosphate on partially purified CSQ2 (Endog PP) were determined. Individual samples of CSQ2 were normalized by immunoblotting. a Sample autoradiogram is shown for purified CSQ2 samples for C and siRNA-treated COS cells (upper panel), along with summary results from analyses of endogenous CSQ2-phosphate content for C and siRNA-treated cells (lower panel, means ± S.E.M., n = 4). b Similar Ad.CSQ-treated COS cells (C or siRNA-treated) were metabolically labeled with 35S[Met] for 2 h, and identical sample volumes were analyzed by SDS-PAGE. The gel was stained with stains-all to highlight CSQ2 as a dark-blue protein band on a pink background (arrowhead), then destained and re-stained with coomassie blue, then dried and placed against film for autoradiography. MW standards (left) are in kDa. The 66 kDa standard is albumin, which also contaminates the sample cultures from the serum in the medium. c Effects of CK2 siRNA on CSQ2 mRNA levels determined by triplicate qPCR measurements (means ± S.E.M., n = 3)
