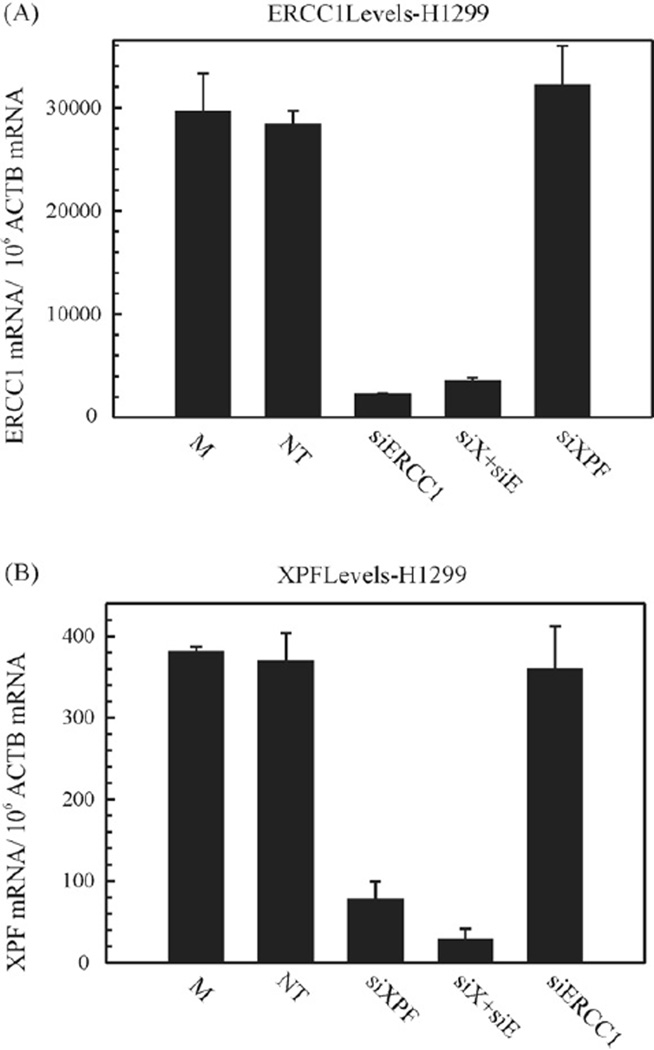
Figure 2.
Transcript levels on siRNA mediated downregulation. (A) represents ERCC1 transcript levels. H1299 cells were mock (M) treated or non-targeting (NT)-, XPF-, ERCC1-, and XPF–ERCC1 (denoted as siX + siE) siRNA transfected, twice at 24 h intervals each and harvested at 48 h post-transfection. Total RNA was extracted from cells and analyzed using StaRT-PCR, as described in Section 2. Each PCR was run in triplicate. The transcript levels are represented as ERCC1 mRNA/106 ACTB mRNA. The values are represented as mean±SEM from triplicate PCRs. (B) represents XPF transcript levels. H1299 cells were mock (M) treated or non-targeting (NT)-, XPF-, ERCC1-, and XPF–ERCC1 (denoted as siX + siE) siRNA transfected, twice at 24 h intervals each and harvested at 48 h post-transfection. Total RNA was extracted from cells and analyzed using StaRT-PCR, as described. Each PCR was run in triplicate. The transcript levels are represented as XPF mRNA/106 ACTB mRNA. The values are represented as mean±SEM from triplicate PCRs.

