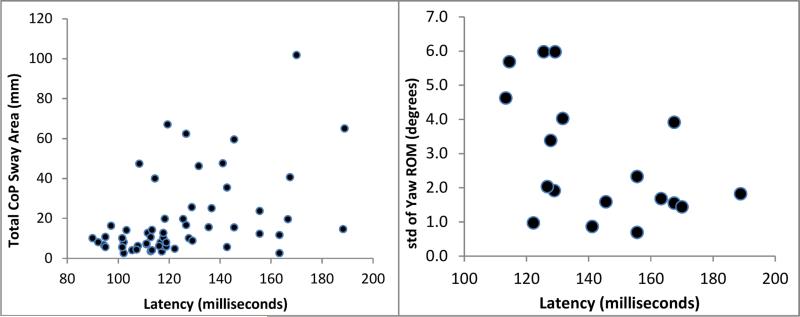
Figure 3.
Correlations plots for total CoP area (left) and standard deviation of yaw range of motion (right) correlated with postural response latency. These plots represent the strongest significant correlations for a CoP variable (ρ = 0.393) across all MS subjects (n = 40) and trunk motion variable (ρ = -0.528) in the slow walking velocity MS group only (n = 20).

