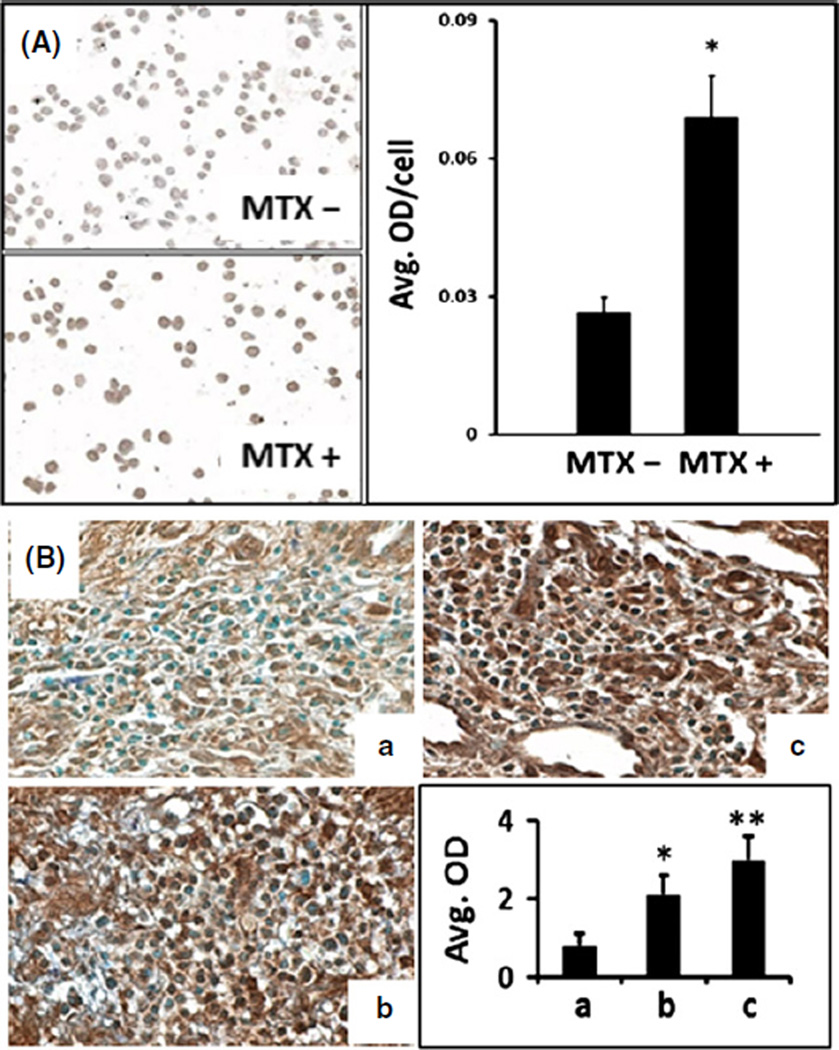
Figure 4.
Multispectral imaging quantifies alterations in FAS protein expression induced by MTX. (A) Photomicrographs and corresponding multispectral imaging histograms show increased FAS expression (*P < 0.01) induced by MTX in CTCL line HH (A) and in serial lesional skin biopsies from a CTCL patient (B). Samples Ba, Bb and Bc represent pre-MTX, MTX for 2 years and MTX for 5 years, respectively. The progressive increase in lesional FAS expression was associated with a gradual improvement in the extent of skin lesions assessed by the percentage of body surface area (BSA) involved. Image magnification ×400. OD: optical density quantified by multispectral imaging. Statistical analysis was performed using Student’s t-test, and a P-value <0.05 was considered statistically significant. (*) and (**) represent P < 0.05 and P < 0.01, respectively.

