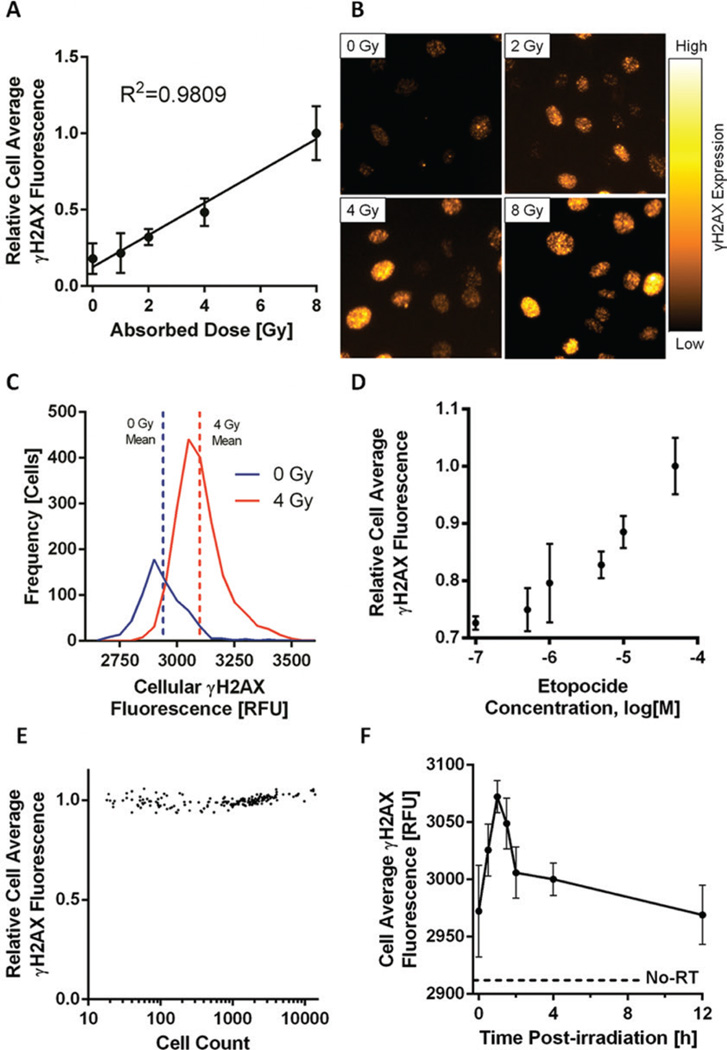
Figure 1. Image cytometry assessment of DNA double-strand breaks (DSBs) by γH2AX fluorescence.
The analysis of γH2AX using image cytometry provides a robust method for detection of DNA DSBs and DSB repair following both radiation and treatment with chemotherapeutic agents. (A) Relative cell average [+/− 95% confidence interval (CI)] γH2AX fluorescence of HeLa cells irradiated with increasing absorbed dose. (B) Representative microscopy images showing γH2AX foci at several dose points. Images were captured using an Olympus BX41 inverted microscope at 40× magnification. (C) The number of cells at each relative fluorescence level demonstrates increased γH2AX fluorescence immediately following a 4 Gy irradiation of HeLa cells (n = 8 wells for each dose point). (D) HeLa cells treated with various concentrations of etopocide to induce DNA DSBs. Cells showed excellent sensitivity over a range of drug concentrations. (E) Wells containing varied confluencies (101–104 cells) of HeLa cells irradiated uniformly to 2 Gy showing γH2AX fluorescence is independent of cell number assayed. (F) To investigate DNA DSB repair kinetics following a 4 Gy irradiation, HeLa cells were fixed at various time points and showed an immediate sharp increase in mean cell average γH2AX fluorescence as a response to DNA DSB induction with a gradual decrease correlating with DNA DSB resolution. Mean cell average γH2AX fluorescence of un-irradiated (No-RT) HeLa cells is shown as a dashed line.

