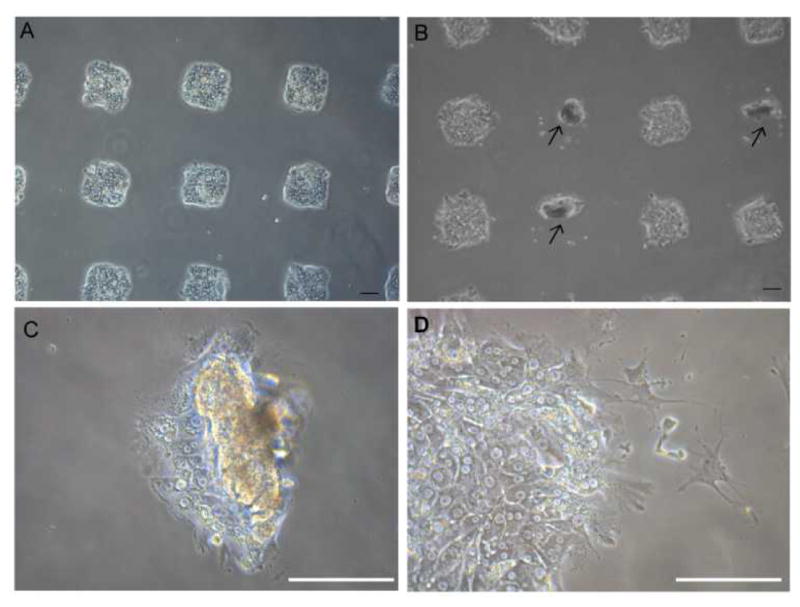
Fig 2. Morphology of rat primary hepatocytes cultured on printed arrays of HGF (500 ng/mL) and TGF-β1 (250 ng/mL).

(A) Brignt field microspcopic image of hepatocytes cultured on an array of 150 μm diameter GF/ECM spots 24h after seeding. 150 μm diameter spots were used to have more spots fit into field of view. (B) Hepatocytes showing divergent phenotypes on the same surface. Presented left column to right, alternating col/TGF-β1 and col/HGF spots. Both spheroids (showing in arrow) and spindle-shaped morphology are observed after 5 days in culture. Higher magnification view of the spheroids on HGF (C) as well as cells on TGF-β1 (D). Scale bar: 100 μm.
