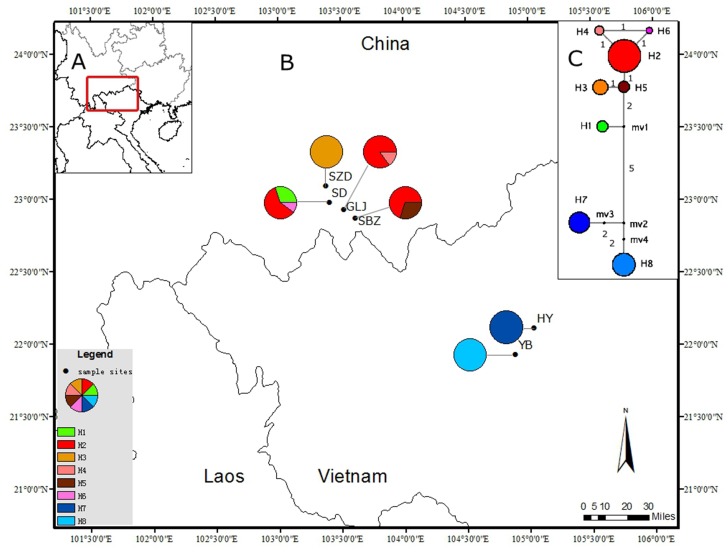
Fig 1. Geographic distribution and evolutionary relationships of the eight cpDNA haplotypes in Cycas multipinnata.
A: General position of map B; B: Pie charts show the proportions of haplotypes within each population. C: The network of the eight cpDNA haplotypes. The numbers on the branches represent the number of mutations between two connected haplotypes and black dots (mv) represent missing haplotypes (not sampled or extinct).

