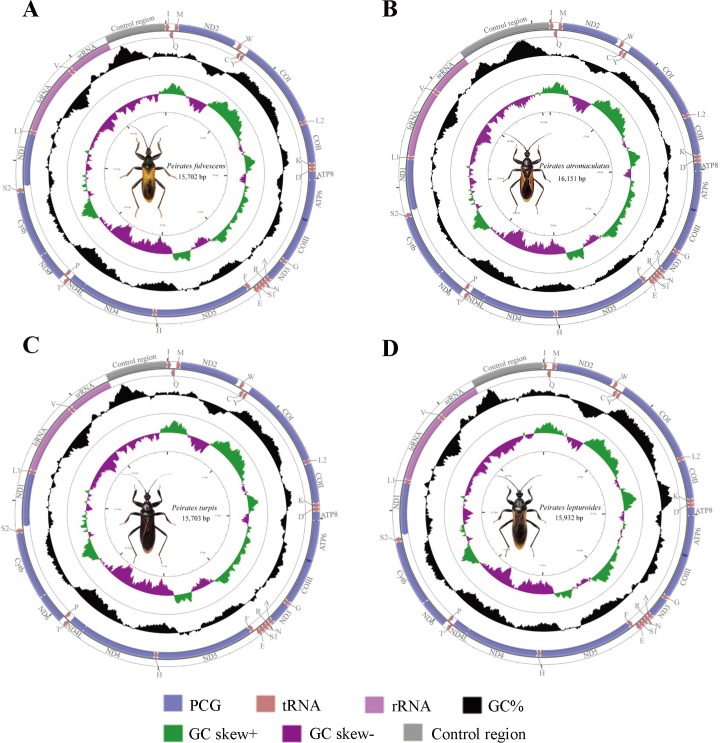
Fig 1. Mitochondrial maps of four sequenced assassin bugs.
Direction of gene transcription is indicated by arrows. PCGs are shown as blue arrows, rRNAs as purple arrows, tRNAs as red arrows and large NC regions (>100 bp) as grey arrows. tRNAs are labeled according to single-letter IUPAC-IUB abbreviations (L1: UUR; L2:CUN; S1:AGN; S2:UCN). The GC content is plotted using a black sliding window, as the deviation from the average GC content of the entire sequence. GC-skew is plotted as the deviation from the average GC-skew of the entire sequence. Ticks in the inner cycle indicate the sequence length.

