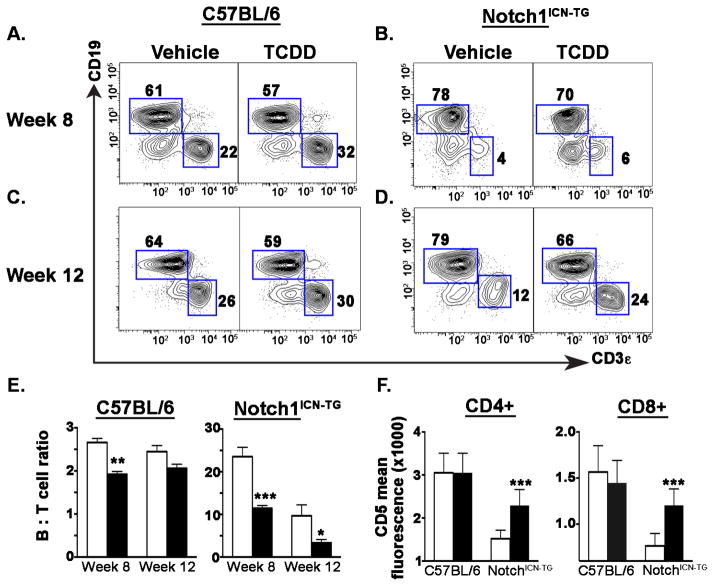
Figure 4. Cell proportions in spleen are altered following developmental exposure to 3μg/kg TCDD or vehicle control.
Pregnant C57BL/6 dams (paired with either C57BL/6 or Notch1ICN-TG males) were exposed to 3μg/kg TCDD or vehicle control throughout gestation (GD0.5, GD7.5, GD14.5, PPD2.5). A and C) Representative flow cytometry plots delineating B and T cells from weeks 8 and 12 C57BL/6 spleen samples; B and D) Representative splenic B versus T cell flow cytometry plots from weeks 8 and12 in Notch1ICN-TG; E) Ratios of B cells to T cells at 8 weeks and 12 weeks, with C57BL/6 mice on the left and Notch1ICN-TG mice on the right; F) Mean fluorescence intensity of CD5 in T-cells from 6–8 week old mice, within the CD4 population on the left and the CD8 population on the right; Vehicle treated mice are represented by a white bar and mice treated with TCDD are represented by a filled bar in D–E. Bars graph mean with SE. A single * indicates p ≤0.05; ** indicates p ≤0.01; *** indicates p ≤0.001. (n=3 C57BL/6 vehicle; n=3 C57BL/6 TCDD; n=8 Notch1ICN-TG vehicle; n=7 Notch1ICN-TG TCDD at week 8; n=4 C57BL/6 vehicle; n=5 C57BL/6 TCDD; n=6 Notch1ICN-TG vehicle; n=8 Notch1ICN-TG TCDD at week 12).

