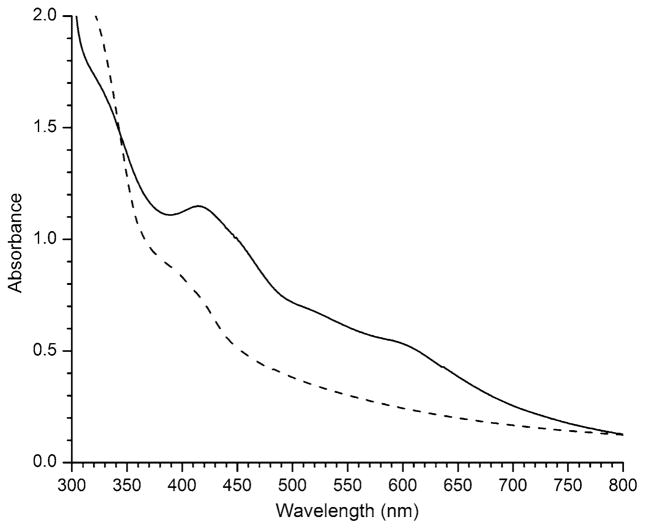
Fig. 4.
UV–vis absorption spectra of SP lyase. Spectra of as-isolated enzyme (solid line) and enzyme reduced with 5-deazariboflavin (dashed line) are presented. For both spectra, the protein was 150 μM in 20 mM sodium phosphate, 350 mM NaCl, 5 mM dithiothreitol (DTT), 5% glycerol, pH 7.5. The reduced protein also contained 100 μM 5-deazariboflavin. The spectra were recorded in a 1 cm path length cuvette under anaerobic conditions at room temperature

