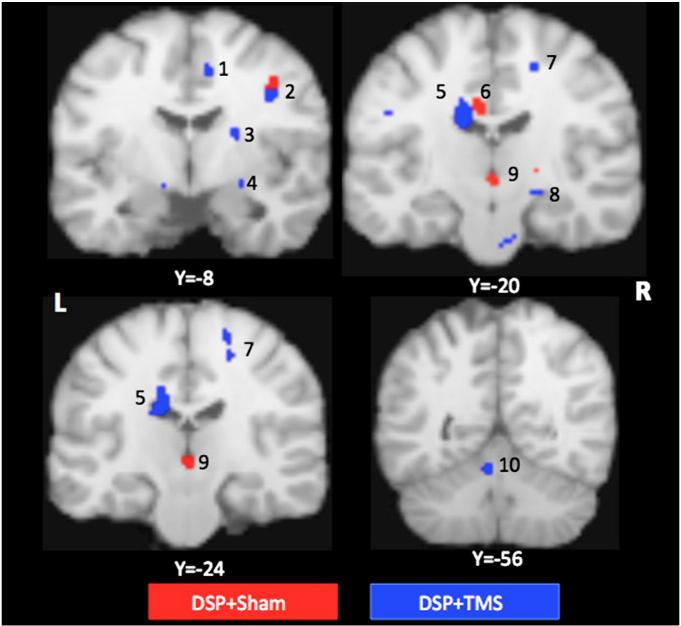
Fig. 6.
Brain regions demonstrating increases in resting CBF after 4 weeks in DSP + sham group (regions in red) and DSP + TMS group (regions in blue). 1. Cingulate cortex (BA 24), 2. premotor cortex, 3. putamen, 4. amygdala, 5. caudate nucleus, 6. cingulate gyrus (BA23), 7. primary motor cortex, 8. parahippocampus, 9. thalamus, and 10. cerebellum. The PET data are overlaid on Colin Brain, and the coordinates are in Talairach system. The left hemisphere is on the left side of the image.

