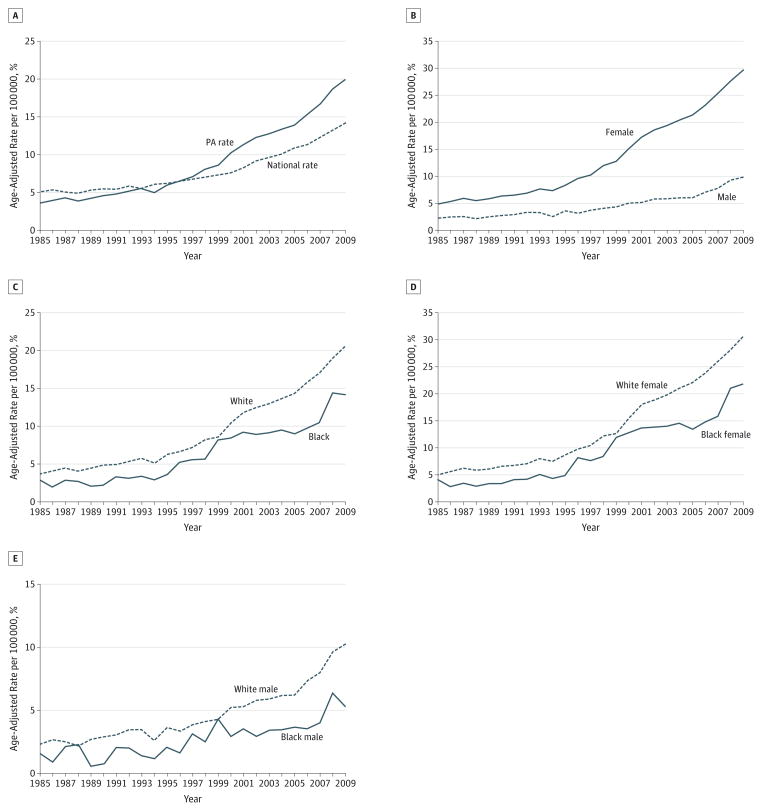
Figure 1.
Incidence of Thyroid Cancer Among Different Groups in Pennsylvania (PA)
Graphs depict the age-adjusted rate of thyroid cancer for PA vs United States (A), males vs females in PA (B), whites vs blacks in PA (C), white females vs black females in PA (D), and white males vs black males in PA (E).

