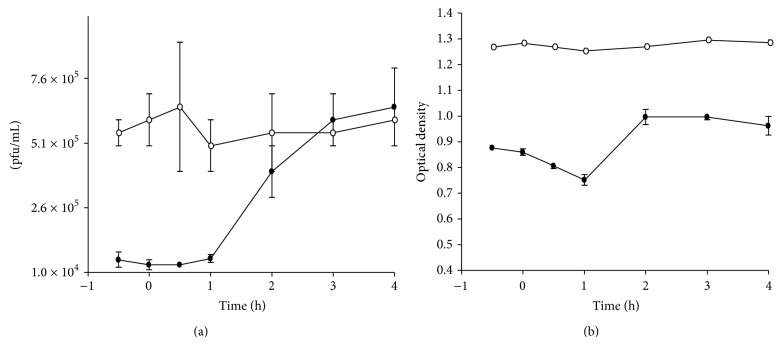
Figure 4.
Time course of treatment of cells with cytochalasin D. The effect of cytochalasin D (0.5 μg/mL) treatment on cells at different times in relation to infection was determined by measuring infectious virus and viral antigen in supernatants harvested at 72 hours. (a) Effect on infectious virus production. (b) Effect on viral antigen. The closed circles represent the drug and the open circles the DMSO control. Each data point was done in quadruplicate.

