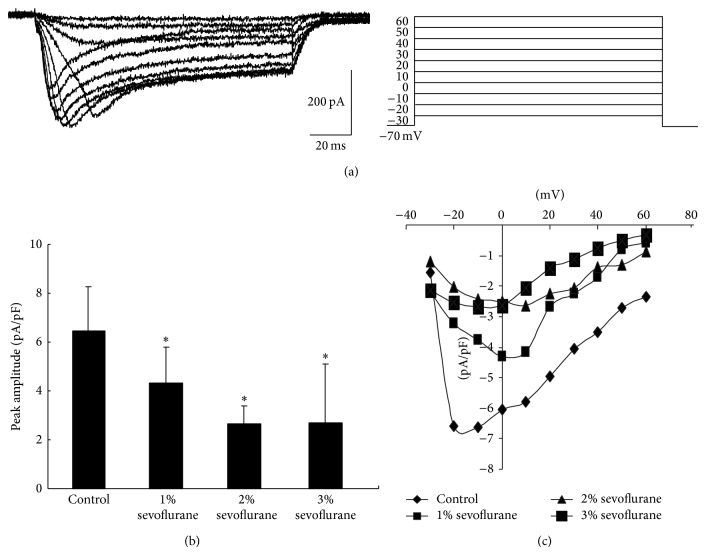
Figure 4.
Calcium currents density was altered 24 h after sevoflurane exposure. (a) This showed the normal calcium currents traces which were recorded in the presence of TTX, TEA, and 4-AP, while recorded neurons were depolarized in a serial voltage step. (b) 24 h after sevoflurane exposure, peak amplitude of calcium currents density was significantly reduced when compared to control (P < 0.05, n = 6, N = 24). (c) Amplitude of calcium current density in each voltage step was shown in this graph. It is clear that peak amplitude of current density was reduced after sevoflurane exposure (P < 0.05, n = 6, N = 24).

