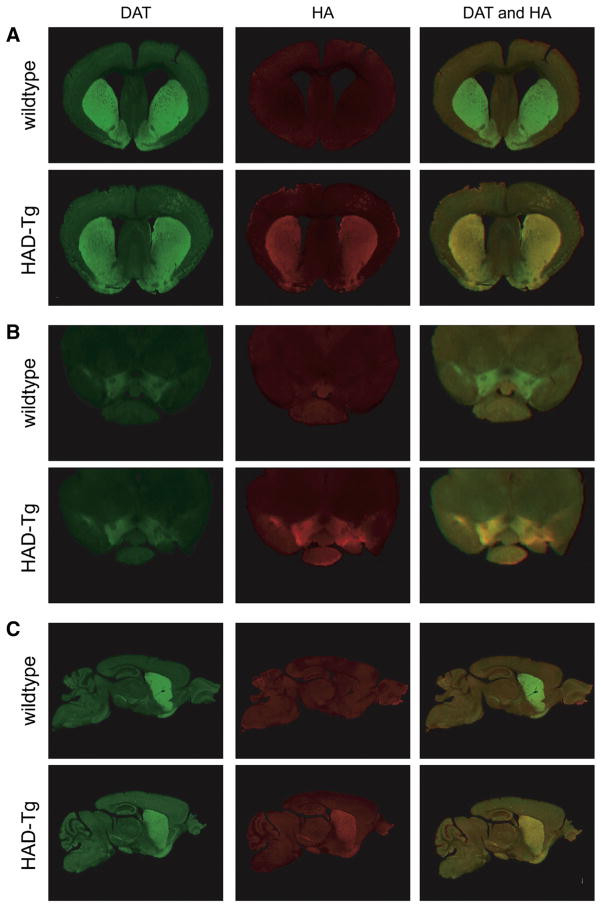
Fig. 2.
Expression pattern of HA-tagged DAT using immunofluorescence. Co-labeling of DAT protein (green) and HA protein (red) in coronal sections of the striatum (A) and midbrain (B). Where both DAT and HA are co-expressed, regions appear yellow. In transgenic mice, HA and DAT are shown to be co-expressed throughout the nigrostriatal pathway, as seen in sagittal sections containing both the midbrain and striatum (C).

