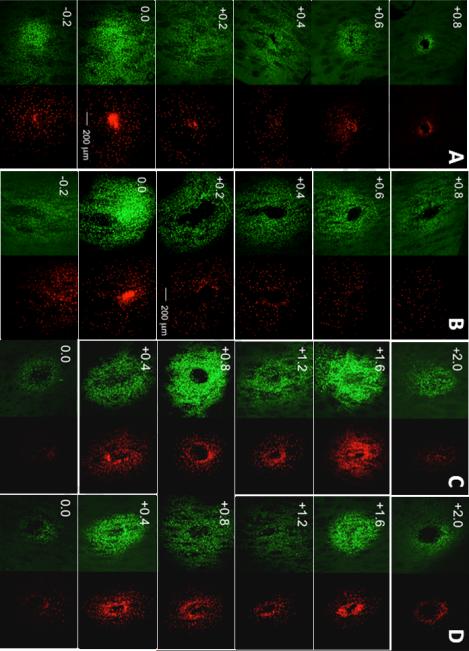
Figure 3.
Representative fluorescent confocal microscopy images (voxel size 2.5 × 2.5 × 3.2 μm) of cell viability-stained 100 μm horizontal sections in PPP with no flow (A), PPP with sampling flow of 50 nL/min (B), microdialysis no flow (C), and microdialysis flow (D). Left column for each probe condition shows H342 (pseudo-colored green) staining and the right column shows SO (pseudo-colored red) staining. Stains were infused together at the end of the sampling period to gauge extent of damaged cells (stained by SO) relative to total cells stained (H342). Sections are labeled according to their relative vertical distance from the sampling tip (0.0) in mm with negative values indicating more ventral. All photomicrographs have identical scaling (scale bar = 200 μm).

