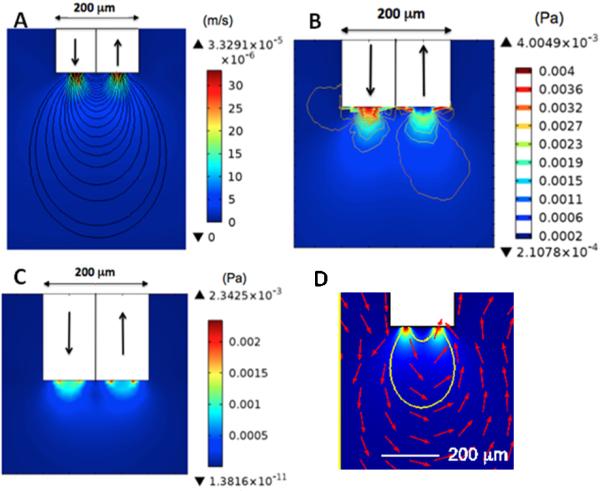
Figure 6.
Numerical modeling of low flow PPP at 50 nL/min. In all drawings, the white area represents the sampling capillary tip and arrows indicate direction of flow. (A) Calculated velocity map. (B) Calculated pressure map. (C) Calculated shear stress map. (D) Close up of data from A with streamlines (in red) indicating direction of flow around probe tip.

