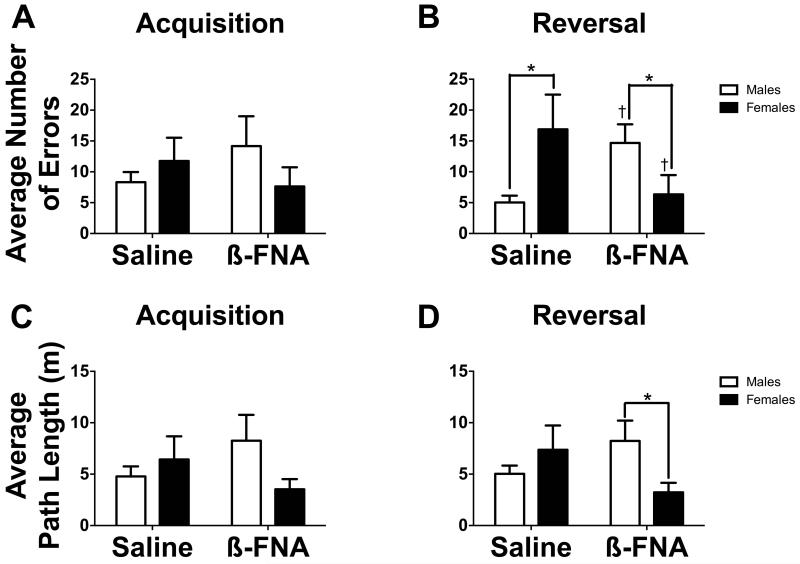
Fig. 5.
(A and B) Bar graphs representing the average number of errors before finding the target hole in (A) acquisition and (B) reversal phases for mice receiving saline or ß-FNA. (C and D) Bar graphs representing the average path length before finding the target hole in (C) acquisition and (D) reversal phases for mice receiving saline or ß-FNA. White bars represent males and black bars represent females (n = 8-10 mice).
*p < 0.05 between sex comparison
†p < 0.05 within sex comparison

