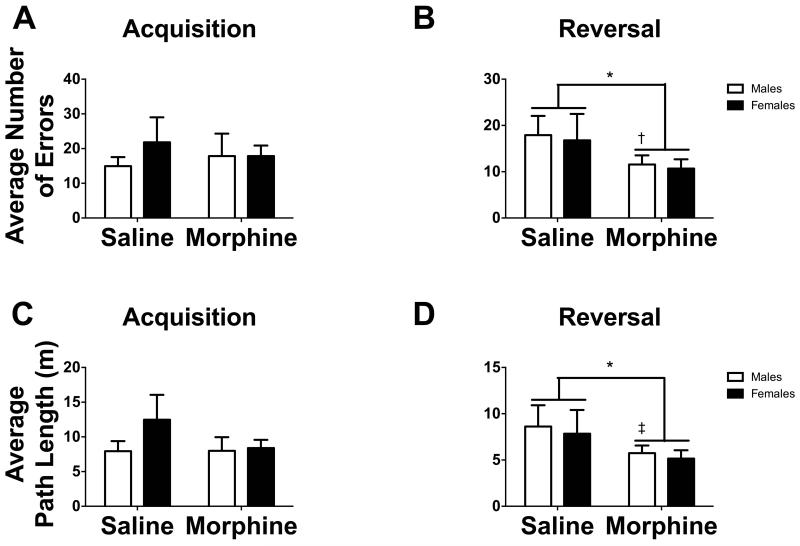
Fig. 6.
(A and B) Bar graphs representing the average number of errors before finding the target hole in (A) acquisition and (B) reversal phases for mice assigned to receive (A) or receiving (B) saline or morphine. (C and D) Bar graphs representing the average path length before finding the target hole in (C) acquisition and (D) reversal phases for mice assigned to receive (C) or receiving (D) saline (n = 5-9 mice) or morphine (n = 11-14 mice). White bars represent males and black bars represent females.
*p < 0.05
†p < 0.05 within sex comparison
‡p < 0.1 within sex comparison

