
Fig. 13.
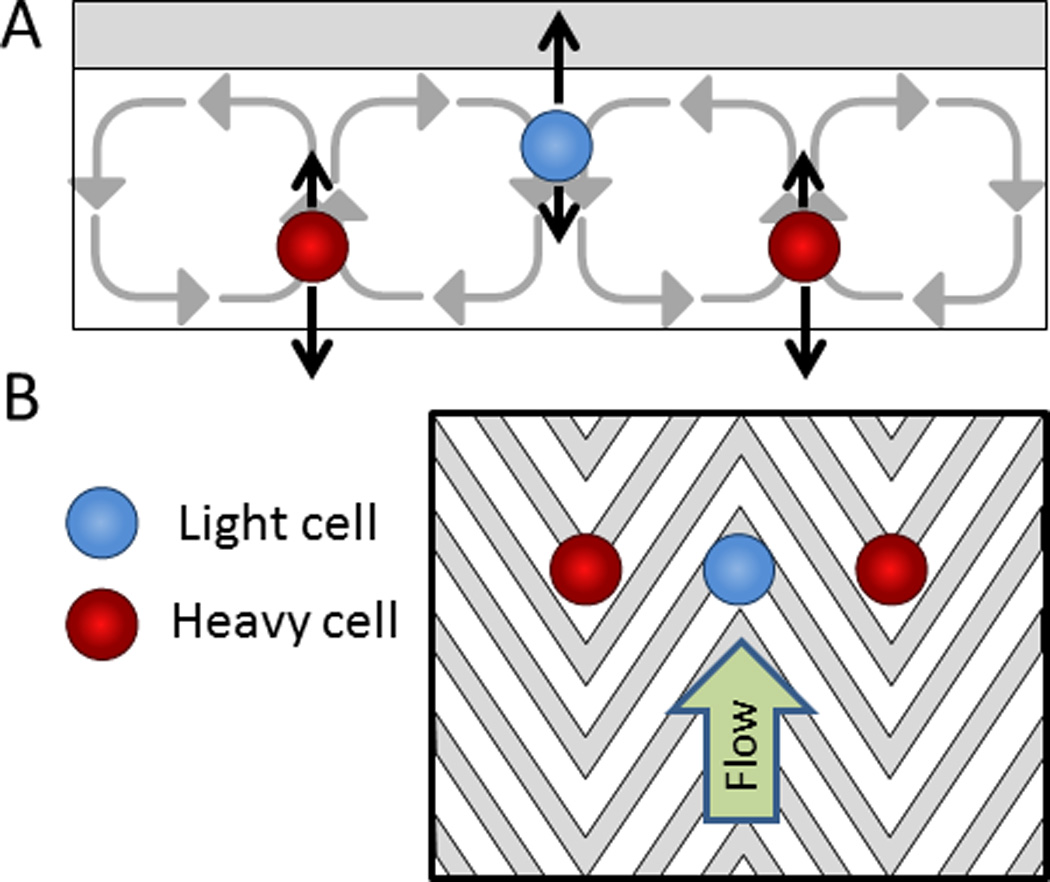
Hydrophoretic cell focusing and sorting. A) A simplified free-body diagram of cells with a low density (shown in blue) separating from cells with a high density (shown in red). The black arrows pointing upwards represent buoyancy forces and the black arrows pointing downwards represent settling forces. B) A top view of the microfluidic channel with herringbone grooves in the ceiling to guide the focusing and separation of cells by density.187