Figure 4.

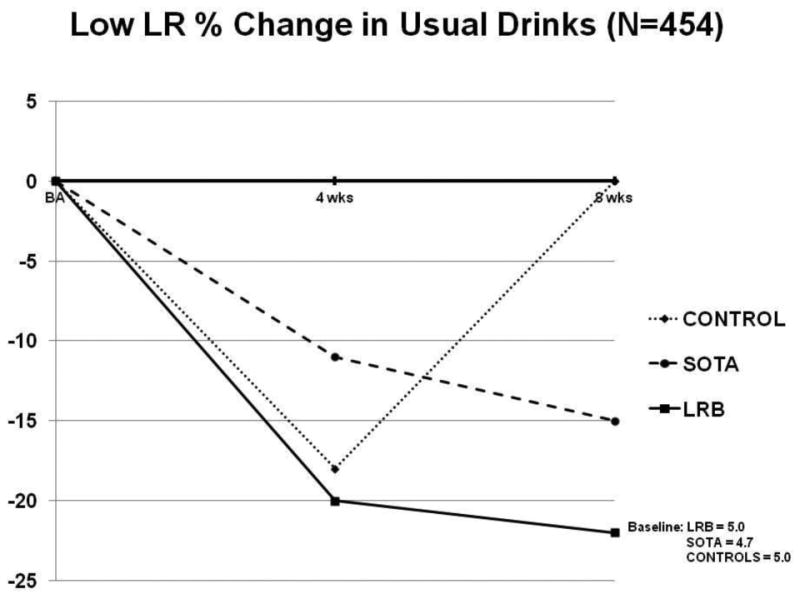
Percentage change in usual drinks per occasion among low LR drinkers in the Control, State Of The Art (SOTA), and Level of Response Based (LRB) groups from Baseline to 4 and 8 weeks.

Percentage change in usual drinks per occasion among low LR drinkers in the Control, State Of The Art (SOTA), and Level of Response Based (LRB) groups from Baseline to 4 and 8 weeks.