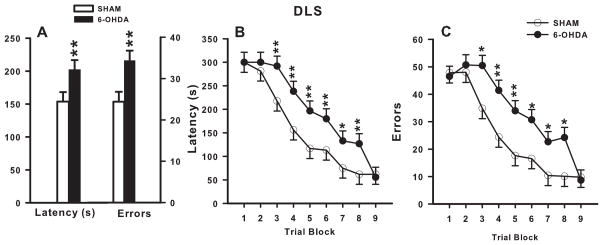
Figure 2. DLS Cincinnati water maze latency and errors.
There was a main effect of lesion: DLS lesioned animals had a longer latency and made more errors than SHAMs (A). Across days, DLS lesioned animals had significantly longer latencies during blocks 3–8 (B) and made significantly more errors during blocks 3–6 and block 8, compared with SHAMs. N = 12/group. *p ≤ 0.05, **p ≤ 0.01.

