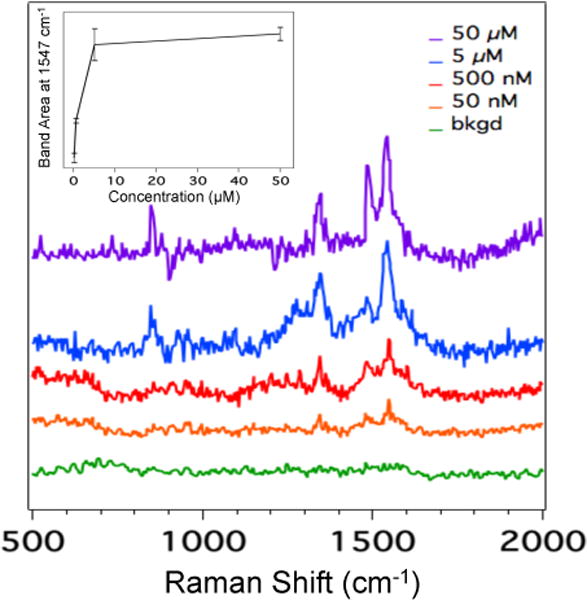
Figure 2.

Averaged SERS spectra of Angiotensin I at concentrations ranging from 50 μM to 50 nM. The inset (plotted in a linear scale) is a plot of the area of the band at 1547 cm−1 assigned to the amide II vibration as a function of Angiotensin I concentration. Error bars in the inset represent the standard deviation.
