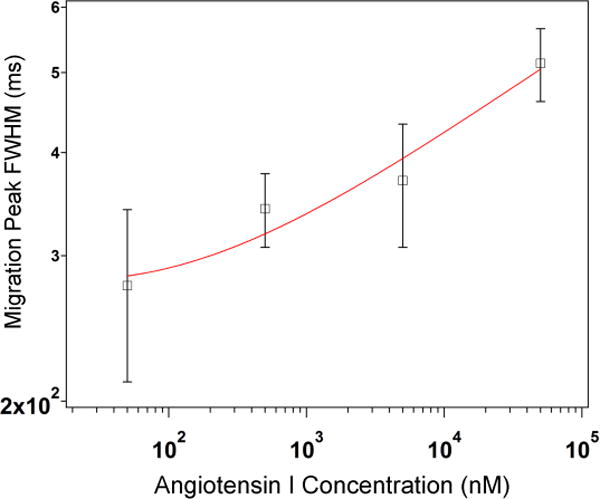
Figure 3.

Log-log plot of the FWHM of the migration peak determined from the 1547 cm−1 band of Angiotensin I as a function of concentration in the range from 50 to 50,000 nM. The red trace represents the log fit. The FWHM values were extracted from the SERS electropherograms for each concentration from the data shown in Fig. 2. Error bars represent the standard deviation.
