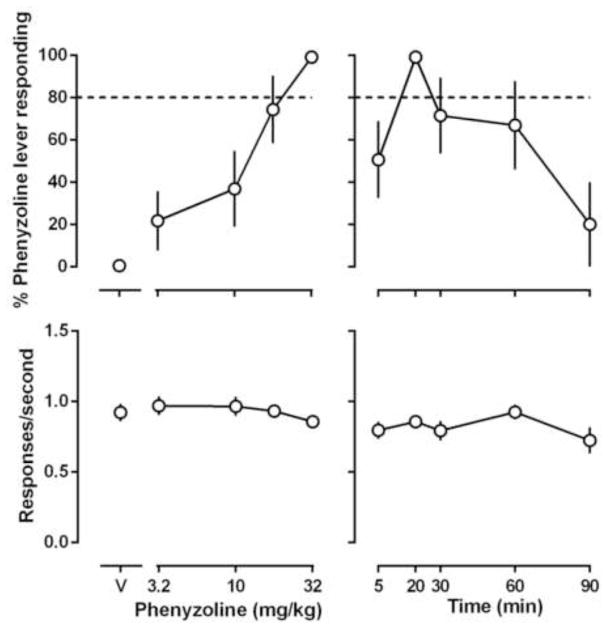
Figure 2.
Effects of phenyzoline in rats trained to discriminate between 32 mg/kg phenyzoline (i.p) and vehicle using a two-lever food-reinforced procedure. The mean (± 1 S.E.M.) percentage of responses on the phenyzoline-appropriate lever (top panels) and the mean (± 1 S.E.M.) rate of responding (bottom panels) are plotted as a function of dose in the left panels and as a function of time after i.p. administration of 32 mg/kg phenyzoline in the right panels. Points above “V” indicate vehicle.

