
Fig. 1. Selection of transcripts for validation.
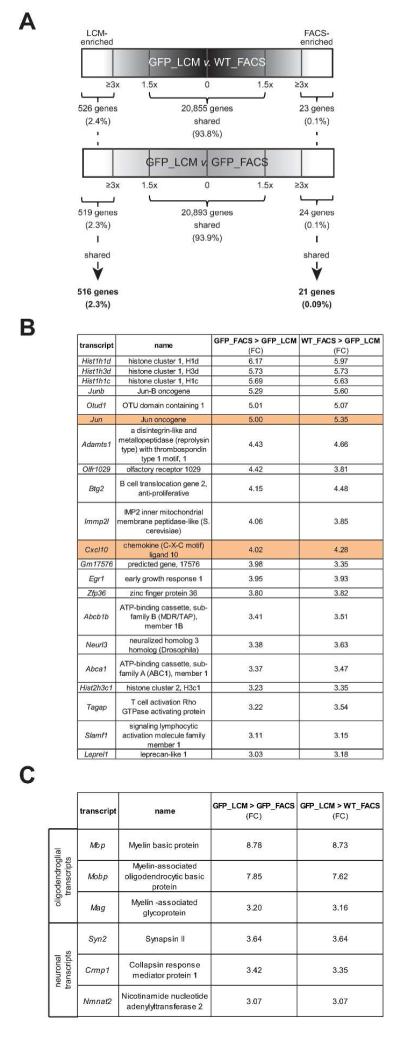
(A) Schematic representation of the transcripts shared and differentially expressed in LCM- and FACS-isolated microglia. The black bar denotes comparisons between WT microglia isolated by FACS (WT_FACS) and Cx3cr1+/GFP microglia isolated by LCM (GFP_LCM), while the gray bar denotes Cx3cr1+/GFP microglia isolated by FACS (GFP_FACS) and Cx3cr1+/GFP microglia isolated by LCM (GFP_LCM). ~94% of the transcripts were shared between microglia isolated by FACS and LCM. Transcripts with a ≥3 fold change (FC) were classified as enriched for LCM-isolated (516 transcripts; 2.3%) or FACS-isolated (21 transcripts; 0.09%) microglia. Candidate transcripts were selected for validation based on a range of FC, importance in microglia function, and cell-type specificity. (B) Transcripts in FACS-sorted microglia show enrichment of transcripts that are involved in several different biological processes, whereas (C) transcripts in LCM-collected microglia are associated with the enrichment of transcripts that are linked to neurons and oligodendrocytes.