Figure 5.
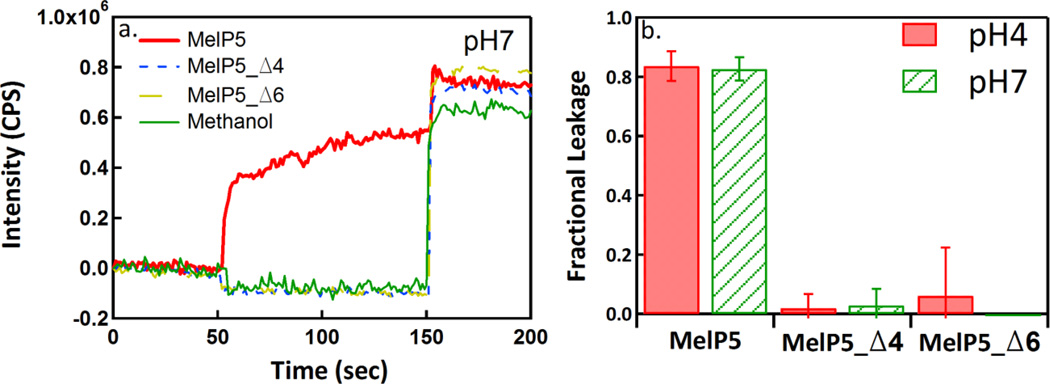
Macromolecular leakage. Panel a shows example FRET measurements of leakage caused by MelP5, MelP5_Δ4 and MelP5_Δ6. Lipid concentration was 1 mM and P:L was 1:100. Excitation of Alexafluor488-streptavidin was at 495 nm and emission of biotin-dextran(10kD)-TAMRA was at 588 nm. An increase in FRET indicates dextran leakage and complex formation. At 150 seconds, Triton X-100 was added to completely permeabilize the vesicles. Panel b shows the fractional leakage of dextran at P:L = 1:100 for all three peptides at both pH 4 and pH 7.

