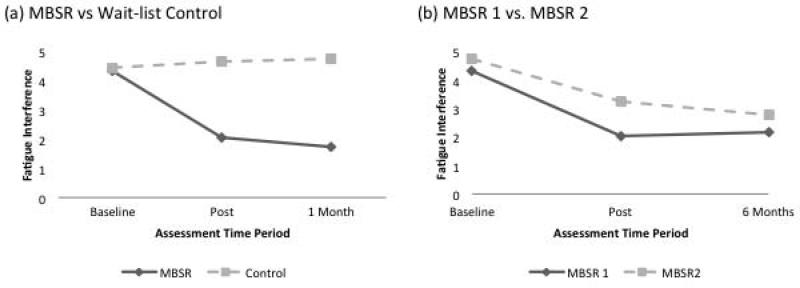
Figure 2.
Figure 2(a) represents the randomized portion of the trial, comparing MBSR to wait-list control at two time points adjusted for baseline differences. Figure 2(b) represents the non-randomized portion of the trial in which the wait-list controls received the MBSR training at the end of the 1-month follow-up. MBSR 1 represents the intervention group, and MBSR 2 represents the wait-list control group. Each group's FSI fatigue interference score immediately before they began the MBSR course represents their baseline score, and the baseline score for each group is compared to their respective post-MBSR and 6-month follow-up scores.

