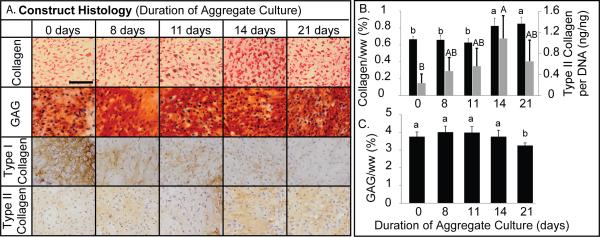
Figure 4.
Self-Assembled Neocartilage ECM Analysis. (A) Neocartilage from each treatment group was analyzed histologically for total collagen, GAGs, type I collagen, and type II collagen. Notably, GAG content varied minimally. With increasing aggregation duration, type I collagen decreased. Scale bar = 100 μm. (B) Neocartilage formed following 14 and 21 days aggregation had the greatest total collagen content, and 14 days significantly increased type II collagen synthesis per cell compared with 0 days. (C) GAG content did not vary appreciably up to 14 days but decreased after 21 days of aggregation. Data are reported as mean ± standard deviation. All groups not connected by a common letter are significantly different (p<0.05).

