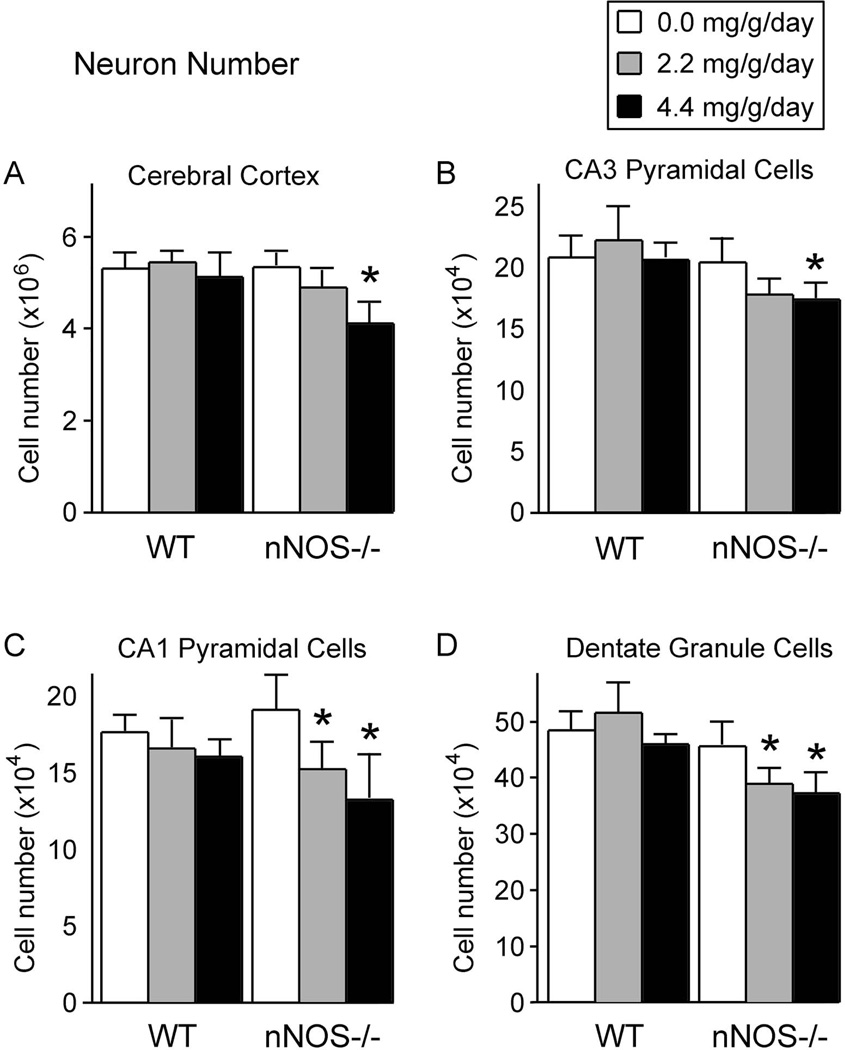
Figure 4. The effect of alcohol on the total number of neurons within the cerebral cortex and subregions of the hippocampal formation in wild type and nNOS−/− mice.
In all four brain regions, in the absence of alcohol, wild type mice and nNOS−/− mice had equivalent numbers of neurons. Thus, absence of nNOS alone had no effect on neuron number. In the cerebral cortex (A) and in the CA3 hippocampal subregion (B), alcohol induced dose-dependent cell losses, but the losses were significant only in the nNOS−/− mice and only at the high alcohol dose. In the CA1 hippocampal subregion (C) and in the dentate gyrus (D), alcohol induced dose-dependent cell losses in the nNOS−/− mice only, and the reductions were significant at both the low and high alcohol doses.
All measures represent means. Error bars represent standard error of the mean.
* Significantly different from the no alcohol group of the same genotype (p<0.05).

