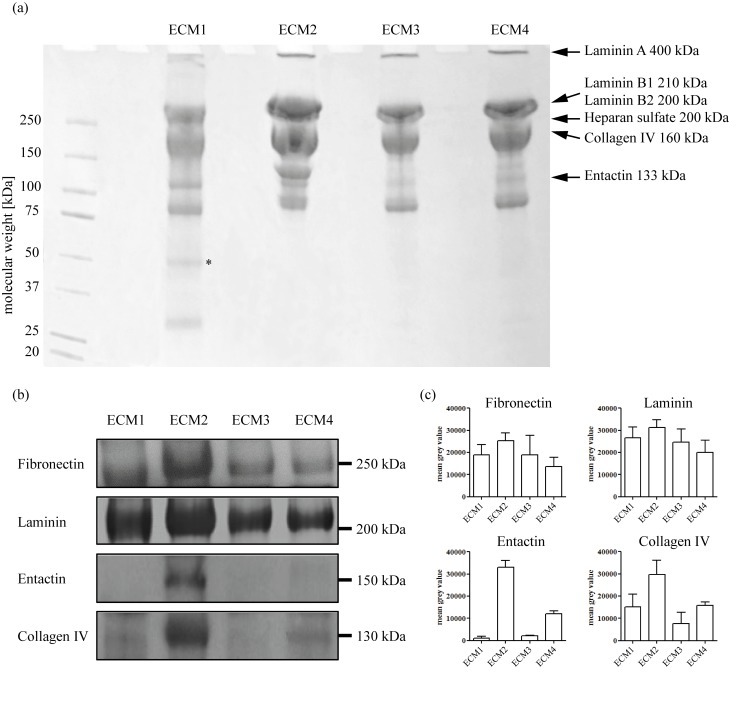
Fig 4. Content of selected ECM proteins in the four different ECM gel variants.
(a) A coomassie staining of the four gel variants shows extra bands in ECM1 at low molecular weight. The star denotes the band which is further investigated by mass spectroscopy (see S2 Table for details). (b) The content of fibronectin, laminin, entactin and collagen type IV in the four different ECM gels is analyzed by western blot (for uncropped blots see S7 Fig.). (c) Densiometric analysis of fibronectin, laminin, entactin and collagen IV signals. The error bars denote the standard deviations as obtained from four independent gel runs.

