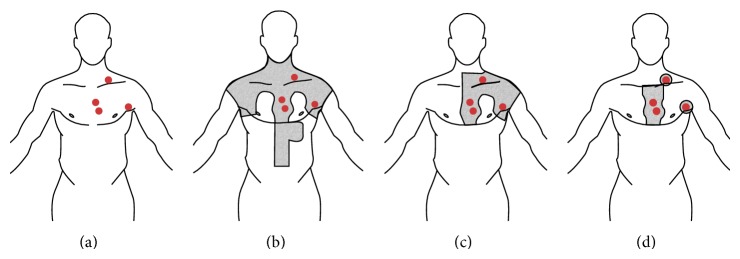
Figure 2.

Images demonstrate changes in radiotherapy surface for HL. In this picture lymph nodes involved with HL disease are illustrated in red. In grey is depicted irradiated field region. (a) Involved lymph nodes, (b) mantle field, (c) IF-RT: involved field radiation therapy, and (d) IN-RT: involved nodal radiation therapy.
