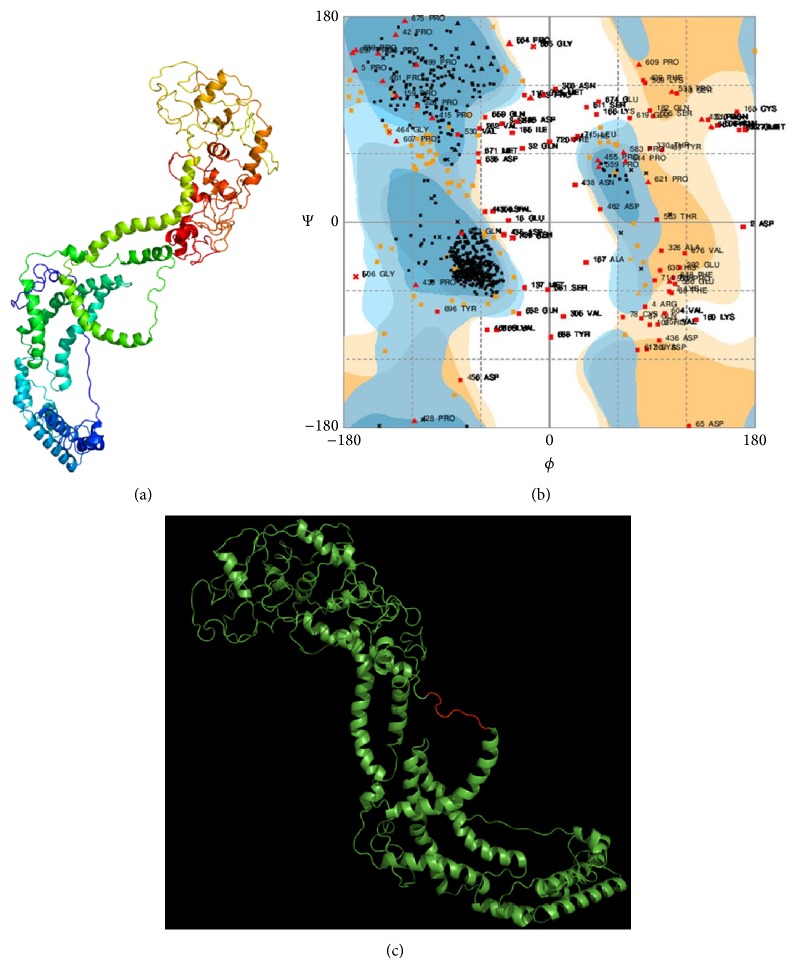
Figure 4.
Mapping of B-cell epitope on the surface of modeled Ebola NP. (a) The homology modeled structure of the Ebola NP protein depicted from the Phyre2 result in cartoon format. (b) Ramachandran plot of the designed 3D structure of the Ebola NP which is obtained from RAMPAGE. (c) Mapping of GEQYQQLR epitope on the surface of Ebola NP where the epitope sequence is represented by red color and rest of the protein structure is represented by green color.

