

Abstract
The paper presents results from the screening of seven monomers used by Eastman Chemical to make various polymers. Ethylene glycol, diethylene glycol, polytetramethylene glycol, isophthalic acid, monosodium-5-sulfoisophthalic acid, 1,4-cyclohexanedicarboxylic acid, and dimethylcyclohexanedicarboxylate were screened for potential androgenicity or estrogenicity. The following studies were conducted: QSAR for binding to the AR and ER, in vitro Androgen Receptor Binding Assay, in vitro Estrogen Receptor Binding Assays (alpha and beta isoforms), in vitro Androgen Receptor Transactivation Assay in human cells, and in vitro Estrogen Receptor Transactivation Assay in human cells. None of the QSAR models predicted that any of the monomers possessed appreciable binding affinity for either AR or ER. Binding assays showed no evidence of interaction with either the AR or the alpha or beta ER receptors. Similarly, the AR and ER transactivation assays were negative. Moreover, six of the seven monomers have been subjected to 13-week and developmental toxicity studies in rats with no androgen- or estrogen-related effects being noted. Given the negative results of the in vitro screening assays (except PMG which demonstrated cytotoxicity) as well as available repeated dose and developmental and reproductive studies, the data suggest that none of the monomers tested exhibit androgenic or estrogenic hazards.
Keywords: Androgenicity, Estrogenicity, In vitro, Polyester monomers, Polymer, QSAR
1. Introduction
The topic of endocrine effects linked to chemical exposure to plastics and their components continues to receive much attention by the news media as well as the scientific community (Casals-Casas and Desvergne, 2011; Diamanti-Kandarakis et al., 2009). Numerous reports have appeared over the last few years presenting data on endocrine activity from various components of plastics or on leachates from plastic (Chung et al., 2013; Guart et al., 2013; Halden, 2010; Muncke, 2011; Ohashi et al., 2005; Ohno et al., 2001, 2003; Talsness et al., 2009; Wagner and Oehlmann, 2009; Yang et al., 2011).
Previously we reported on the absence of androgenicity and estrogenicity of the three monomers used to make Eastman's Tritan™ copolyester: dimethyl terephthalate (DMT), 1,4-cyclohexanedimethanol (CHDM), and 2,2,4,4-tetramethyl-1,3-cyclobutanediol (TMCD) (Osimitz et al., 2012). QSAR models for binding to the androgen receptor and estrogen receptors (alpha and beta) as well as a battery of in vitro and in vivo assays were conducted to determine their potential androgenicity or estrogenicity.
The present paper presents results from the screening of several additional monomers used by Eastman Chemical to make various polymers. These include:
- Ethylene glycol and related
- ○ Ethylene glycol (EG; CASRN 107-21-1)
- ○ Diethylene glycol (DEG; CASRN 111-46-6)
- ○ Polytetramethylene glycol (PMG; CASRN 25190-06-1)
- Terephthalic acid (TPA) and related
- ○ Isophthalic acid (IPA; CASRN 121-91-5)
- ○ Monosodium-5-sulfoisophthalic acid (5-SSIPA; CASRN 6362-79-4)
- ○ Terephthalic acid (TPA; CASRN 100-21-0)
- 1,4-Cyclohexanedimethanol (CHDM) and related
- ○ 1,4-Cyclohexanedicarboxylic acid (CHDA; CASRN 1076-97-7)
- ○ Dimethylcyclohexanedicarboxylate (DMCD; CASRN 94-60- 0) – cis and trans.
Please note that the test material DMCD contained circa 90% trans isomer. DMCD cis and trans isomers were modeled separately resulting in modeling data for the monomers.
The monomers discussed in this report are used to make a variety of polyesters that are approved for use in food packaging and food processing applications in the United States, the European Union, and other countries. Some of the polyesters are used for the primary food contact surface while others are used only in applications such as food packaging adhesives.
Various in vitro and in vivo assays, and in silico (computational) screening and related molecular modeling approaches are available to predict or evaluate endocrine activity (DeLisle et al., 2001; Meek et al., 2006; Vinggaard et al., 2008; Zauhar et al., 2003). We used a battery of in vitro assays that followed standardized protocols, analogous to the Tier I screen developed by the United States Environmental Protection Agency (USEPA) as part of the Endocrine Disruption Screening Program (EDSP) (USEPA, 2008). The assays were chosen to detect the ability of the monomers to bind to androgen and/or estrogen receptors and, through use of transactivation assays, to activate the androgen or estrogen receptor. Specifically, the following studies were conducted:
QSAR for binding to the AR and ER
In vitro Androgen Receptor Binding Assay
In vitro Estrogen Receptor Binding Assays (alpha and beta isoforms)
In vitro Androgen Receptor Transactivation Assay in Human Cells
In vitro Estrogen Receptor Transactivation Assay in Human Cells
These data are considered in the context of other in vivo data developed to assess systemic, developmental, and reproductive toxicity regarding the potential androgenic and estrogenic hazards associated with the monomers.
2. Materials and methods
2.1. Quantitative Structure–Activity Relationship (QSAR) models
Five separate models were constructed to estimate ER binding. One of these models, the molecular docking model, provided a quantitative value that can be used to gauge relative binding affinity (RBA). The four remaining QSAR models, constructed using pre-computed molecular descriptors, were employed to classify the compounds as “active” or “inactive”. Generally, classification models are more appropriate than quantitative models when the number of compounds in the training data set is too small for statistically significant numerical calculation of the RBA.
The QSAR models were constructed using well-established machine learning methods: Bayesian inference analysis, Support Vector Machine (SVM), Artificial Neural Network (ANN), and Classification and Regression Tree (CART). A brief description of each model follows:
Bayesian inference analysis: Binary QSAR is implemented in the Molecular Operation Environment molecular modeling tool (MOE) software suite. Based on a Bayesian inference technique, this method estimates the probability density classifying the compounds as active or inactive.
SVM is a non-linear model that performs pattern recognition by finding an optimal hyperplane as the decision boundary for separating two classes of patterns, which can maximize the margin between the closest data points of each class.
ANNs are designed to mimic simple biological neural networks that learn rules and relationships between stimuli (inputs) and response (outputs) through a trial-and-error process.
CART is a prediction model constructed by recursively partitioning a data set and fitting a simple model to each partition.
2.1.1. Molecular docking
The molecular docking studies were performed using the crystal structures of human ER alpha, ER beta and AR. The three-dimensional X-ray crystallographic structural models of the ER alpha, ER beta and AR ligand binding domains were retrieved from the Protein Data Bank (entries 3ERD, 2J7Y, and 1XOW, respectively). Using the commercial software GOLD (Verdonk et al., 2003) each small-molecule compound in the data set, comprising >100 compounds, was computationally docked inside the ligand binding pocket of the three respective receptors. To determine the cutoff threshold for docking, the same compounds comprising the training set for QSAR modeling were docked into each of the three human protein structures 30 times independently. For each protein, the docking score with the highest value for a given compound was used in ranking the series of compounds. The mean value of these ranked scores (score = 40) was taken as a soft cutoff threshold in the molecular docking study to distinguish between binding and non-binding ligands. In this regard, the term “soft” is meant to convey that any compound scoring in the 35–45 buffer region was visually scrutinized in its receptor-docked pose and re-docked multiple times to verify the reproducibility of the compound's docking pose and score. In all cases, the docking scores of the compounds were sufficiently reproducible to justify our class assignments (i.e., binders vs. non-binders).
2.2. In Vitro androgen receptor binding assay
The androgen receptor (AR) binding assay (Invitrogen™, Life Technologies Corporation, Carlsbad, CA) uses a sensitive polarographic detection system based on a fluorescent labeled ligand Fluormone™ to form a receptor–ligand complex with a subsequent high polarization value that is added to varying concentrations of test compounds. A reduction in the polarization signal will occur if a test compound has the ability to displace the Fluormone ligand from the complex and to competitively bind to the receptor. The assay provides data on the absolute and relative binding affinity and potency of test compounds (Osimitz et al., 2012).
Briefly, 20 μL of 2 nM Fluormone and 50 nM AR ligand binding domain (ARLBD) were added to test articles serially diluted with dimethylsulfoxide (DMSO) in 384 well black plates, but not to wells designated as “free ligand” controls. The free ligand control wells received 20 μL of AR Green assay buffer with 2 nM Fluormone but without receptor. Final concentrations in the test wells were 1 nM Fluormone AR Green and 25 nM AR-LBD and 0.05% DMSO and test article. The limit of solubility of the monomers and reference controls were determined by nephelometry, a light scattering procedure (Nepheloskan Ascent® by Labsystems). Each test article and control exposure concentration was run in triplicate in at least two independent experiments. The monomers were evaluated for fluorescent properties that might interfere with the fluorescent polarization assay. The monomers in assay buffer were read with non-polarized light at the same excitation and emission wavelengths used in the fluorescence polarization assay.
Following the 4 to 6 hour incubation, the assay plates were read with a PerkinElmer Envision spectrophotometer at excitation and emission wavelengths of 480 nm and 535 nm, respectively. Data were transferred into Prism 5.01 (GraphPad Software, Inc.) for plots and regression curve analysis. The response values were normalized to 100% response (highest concentration of DHT, 10 μM) and 0% response (DMSO control). Ligand displacement curves were analyzed by performing regression analysis using the equation for one site competition (Y = bottom + (top-bottom)/(1 + 10^ (X-logEC50)) with the bottom of the curve constrained to 0% millipolarization (mP).
The data were evaluated in accord with the USEPA Technical Review Document for the EDSP Proposed Tier 1 Screening Battery (USEPA, 2008). Under these guidelines, if the test article causes the binding curve to drop below 50%, it is considered evidence of a potential AR binder, between 50 and 75% is equivocal, and if the curve is above or equal to 75% it is considered to be a non-binder.
2.3. In Vitro estrogen receptor binding assay (alpha and beta)
The ER Binding Assays are highly specific in vitro screens that are used to identify chemicals that can bind to the ER (alpha and beta). These assays use the same test system (Invitrogen™, Life Technologies Corporation) and evaluation algorithm as the AR Binding Assay. Briefly, stock solutions of the monomer were prepared in DMSO. E2 was used as the positive control for estrogen binding. Vehicle controls (DMSO) were included as negative controls on each plate. Thirty microliters of 2 nM Fluormone and 20 nM human ER beta (15 nM human ER alpha) were added to test articles serially diluted with dimethylsulfoxide (DMSO) in 384 well black plates, but not to wells designated as “free ligand” controls. The free ligand control wells received 30 μL of Fluormone ES2 buffer with 2 nM Fluormone but without receptor. Final concentrations in the test wells were 1 nM Fluormone and 10 nM ER beta (7.5 nM ER alpha) and 0.05% DMSO and test article. The limit of solubility of the monomers and reference controls were determined by nephelometry, a light scattering procedure (Nepheloskan Ascent® by Labsystems). Each test article and control exposure concentration was run in triplicate in at least two independent experiments. The monomers were evaluated for fluorescent properties that might interfere with the fluorescent polarization assay. The monomers in assay buffer were read with non-polarized light at the same excitation and emission wavelengths used in the fluorescence polarization assay.
Following the 2 hour incubation, the assay plates were read with a PerkinElmer Envision spectrophotometer at excitation and emission wavelengths of 480 nm and 535 nm, respectively. Data were transferred into Prism 5.01 (GraphPad Software, Inc.) for plots and regression curve analysis. The response values were normalized to 100% response (highest concentration of E2, 100 nM) and 0% response (DMSO control). Ligand displacement curves were analyzed by performing regression analysis using the equation for one site competition (Y = bottom + (top-bottom)/(1 + 10^ (X-logEC50)) with the bottom of the curve constrained to 0% mP.
2.4. In Vitro androgen receptor transactivation assay in human cells
This assay is used to identify chemicals capable of inducing androgen-mediated gene expression (transactivation). It uses a sensitive cell based luciferase reporter with MDA-kb2 cells stably transfected with an AR-responsive promoter (mouse mammary tumor virus, MMTV) linked to a luciferase reporter gene (Wilson et al., 2002). This model was also used to evaluate anti-androgen activity. Briefly, for androgenic and anti-androgenic assays, MDA-kb2 cells were seeded into individual 96-well culture plates in Leibovitz's L-15 media at a density of approximately 10,000 cells/well. Cells were grown for approximately 24 hours prior to exposure to test article or reference controls. Exposure time was 24 hours. Each plate included several control groups as follows: vehicle control (0.5% DMSO), maximal response agonist control (10 nM dihydrotestosterone; DHT), and internal control (10 μM nilutamide).
The stability of the cell line was monitored by running complete concentration response curves for the strong AR agonist, dihydrotestosterone (DHT), weak AR antagonist, 4-nonylphenol, and the strong antagonist, nilutamide (NIL) (see supplementary material). The data were then compared to historical data each time the transcriptional activation assay was performed.
For agonist assays, all concentrations of reference controls and monomers were tested in replicates of six/plate with the addition of two replicates/plate that incorporated the antagonist, nilutamide (10 μM), used as an internal control, to allow for the identification of non-specific (i.e., non-androgen receptor mediated) induction of the luciferase gene.
To assess for potential antagonism, increasing concentrations of monomers (or reference controls) were co-incubated with low concentrations of agonist (1 nM DHT, N = 4 per exposure concentration) and high concentrations of agonist (1000 nM DHT; N = 4 per exposure concentration). Displacement of the 1 nM DHT by increasing concentrations of test article may elicit an antagonistic response curve. The specificity of the response is then compared to the high agonist concentration (1000 nM DHT) where much higher concentrations of test material are necessary to elicit an antagonist response curve. By using this method, non-androgenic receptor mediated antagonism or cytotoxicity, where both curves decrease together, can be separated from a true AR receptor mediated response (separation between low and high DHT concentrations).
Statistical parameters such as Mean, Standard Deviations, Standard Error of the Mean and Coefficient of Variation were determined. Each data point was normalized to the average of the vehicle-only treated control (fold induction). The final fold induction results were then transferred into Prism 5.01 (GraphPad Software, Inc.) (one representative run for plots).
Induction of the positive control, 10 nM DHT was more than 50-fold over average of vehicle control wells. In addition, cytotoxicity was monitored using a modified propidium iodide (PI) assay (Dengler et al., 1995). PI is a dye that cannot cross the plasma membrane of intact and viable cells; however, it can cross the cell membrane in cells that are dying or dead. Once inside the cell, PI intercalates into DNA/RNA and yields a fluorescent signal. Briefly, cells were seeded into a 96-well black sided culture plate at the same time cells were seeded for the transactivation assay. Following the approximately 24 hour incubation with the test articles (or reference controls), the growth medium was removed from the plate and 50 μL of the PI solution (44 μM in phosphate buffered saline or cell culture medium) was added to each well.
Background values were obtained by reading the plates immediately on a Packard Fusion fluorescent plate reader at an excitation and emission of 544 nm and 612 nm, respectively. Cells were lysed by adding 50 μL of a 2% (v/v) Triton™ X-100 solution to each well and plates were incubated for approximately 30 minutes at RT and read at the same wavelengths. Digitonin (125 μM) was used as the positive control for cell death. The change in cell viability was determined by comparing the treated wells to the untreated or control wells where a more than 20% reduction in cell viability was considered cytotoxic. The solubility of the test compounds for all exposure concentrations in the cell culture medium was also assessed by nephelometry. See Osimitz et al. (2012) for more details.
2.5. In Vitro estrogen receptor transactivation assay in human cells
This assay uses the T47D-KBluc cell line and is designed to identify chemicals capable of inducing estrogen mediated gene expression (transactivation) (Wilson et al., 2004). Anti-estrogenic activities were also evaluated in this model. Briefly, T47DKBluc cells were seeded into individual 96 well culture plates at a density of approximately 10,000 cells/well and grown for approximately 24 hours prior to exposure to test article or reference controls. Exposure time was 24 hours. Each plate included several control groups as follows: vehicle control (0.5% DMSO), maximal response agonist control (1 nM 17β-estradiol, E2), and internal control (0.1 μM ICI 182,780).
Stability and performance of the cell line was monitored each time the transcriptional activation assay was performed by running complete concentration response curves for the strong ER agonist, 17β-estradiol (E2), weak ER agonist, methoxychlor, and the strong antagonist, ICI 182,780 (see supplementary material). The data were compared to historical data.
For agonist assays, all concentrations were tested in replicates of six/plate with the addition of two replicates/plate that incorporated the antagonist ICI 182,780 (0.1 μM), used as an internal control, which allows for the identification of nonspecific (i.e. non-estrogenic receptor mediated) induction of the luciferase gene.
For antagonism, four replicates/plate were tested with low concentration of the agonist (0.1 nM E2) where displacement of the 0.1 nM E2 by increasing concentrations of test article may elicit an agonistic response curve. The specificity of the response is then compared to the high agonist concentration (100 nM E2, four replicates/plate) where much higher concentrations of test material would be necessary to elicit a positive response curve. Using this method, non-estrogenic receptor mediated antagonism or cytotoxicity, where both curves decrease together, can be separated from a true ER receptor mediated response (separation between high and low E2 concentrations).
Statistical parameters such as Mean, Standard Deviations, Standard Error of the Mean and Coefficient of Variation were determined. Each data point was normalized to the average of the vehicle-only treated control (fold-induction). Induction of the maximal positive control, 0.1 nM E2 was more than 18-fold over the average of the vehicle control wells. The final fold induction results were then transferred into Prism 5.01 (GraphPad Software, Inc.) and representative plots are shown.
In addition, cytotoxicity was monitored using a modified propidium iodide (PI) assay (Dengler et al., 1995) as outlined above for AR transactivation. The solubility of the test compounds for all exposure concentrations in the cell culture medium was also assessed by nephelometry. See Osimitz et al. (2012) for more details.
3. Results
3.1. QSAR
Neither the molecular docking studies nor any of the QSAR models predicted that any of the monomers possessed appreciable binding affinity for either AR or ER. Table 1 shows the results of the molecular docking model, the only model that provides a quantitative value that is a function of RBA.
Table 1.
Predicted binding activity based on molecular docking (compounds with a Gold docking score less than 40 are considered non-binders to ER and AR).
| Compound | Structure | GOLD Score |
||
|---|---|---|---|---|
| AR | ERα | ERβ | ||
| 17β-Estradiol CASRN 50-28-2 |
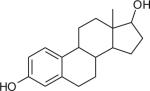
|
NA | 52.62 | 55.49 |
| Dihydrotestosterone (DHT) CASRN 521-18-6 |
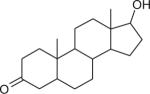
|
58.45 | NA | NA |
| Ethylene glycol (EG) CASRN 107-21-1 |
|
16.87 | 24.32 | 25.44 |
| Diethylene glycol (DEG) CASRN 111-46-6 |
|
23.19 | 26.62 | 28.86 |
| Polytetramethylene glycol (PMG) CASRN 25190-06-1 |
|
NA | NA | NA |
| Terephthalic acid (TPA) CASRN 100-21-0 |
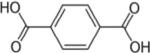
|
26.62 | 30.51 | 35.56 |
| Isophthalic acid (IPA) CASRN 121-91-5 |
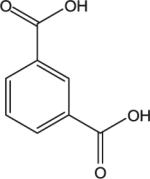
|
27.73 | 29.54 | 32.50 |
| Monosodium-5- sulfoisophthalic acid (5-SS1PA) CASRN 6362-79-4 |
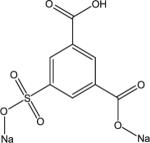
|
29.73 | 31.94 | 35.71 |
| 1,4-Cyclohexanedicarboxylic acid (CHDA) CASRN 1076-97-7 |
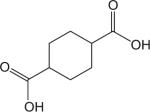
|
32.04 (cis) 31.69 (trans) | 31.02 (cis) 31.05 (trans) | 29.76 (cis) 27.3 (trans) |
| Dimethylcyclohexane-dicarboxylate (DMCD) - Cis and Trans CASRN 94-60-0 |
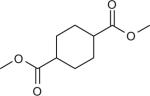
|
37.84 (cis) 36.68 (trans) | 35.16 (cis) 34.66 (trans) | 37.75 (cis) 34.60 (trans) |
NA = Not applicable (docking simulation was not conducted for molecule).
3.2. In Vitro androgen receptor binding assay
None of the monomers resulted in a significant displacement of the ligand from the receptor; however, ethylene glycol was considered equivocal as the binding curve was between 50% and 75%. Thus, all monomers tested were classified as non-binders or equivocal for AR binding. Figure 1 shows the data for the ethylene glycol and terephthalic acid related compounds with the strong positive reference control, E2. Plots show an average of two independent assays each with three replicates/exposure concentration (Mean ± Standard Deviation, average of two runs, six replicates). Data outside of the solubility or fluorescence interference limits were removed from the graphs.
Fig. 1.
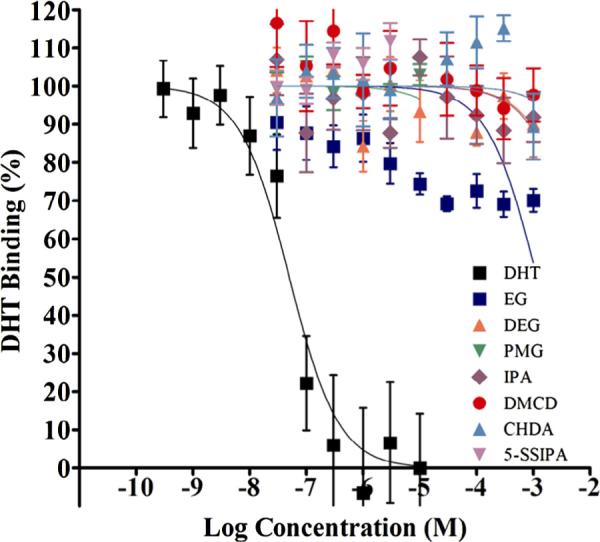
AR binding of the monomers with reference control, DHT. Competitive binding curves of the strong positive reference control, DHT, and monomers against AR ligand binding domain (AR-LBD). Increasing concentrations of DHT and monomers were incubated with AR-LBD and Fluormone™ at RT for 4–6 hours followed by measurement of fluorescence polarization. Polarization data were converted to percent inhibition and plotted against logM concentration. Data points representing two independent assays each with three replicates/exposure concentration were combined and plotted together as one competitive binding curve (Mean ± StDev, average of six replicates).
3.3. In Vitro estrogen receptor binding assay
None of the monomers resulted in a significant displacement of the ligand from the receptor. Thus, all monomers tested were classified as non-binders for both the estrogen alpha and beta receptors. Figure 2 shows data for the ethylene glycol and terephthalic acid related compounds for the alpha receptor along with the strong positive control, E2. Figure 3 shows the data for ethylene glycol and terephthalic acid related compounds for the beta receptor along with the strong positive reference control, E2. Plots show an average of two independent assays each with three replicates/exposure concentration (Mean ± Standard Deviation, average of two runs, six replicates). Data outside of the solubility or fluorescence interference limits were removed from the graphs.
Fig. 2.
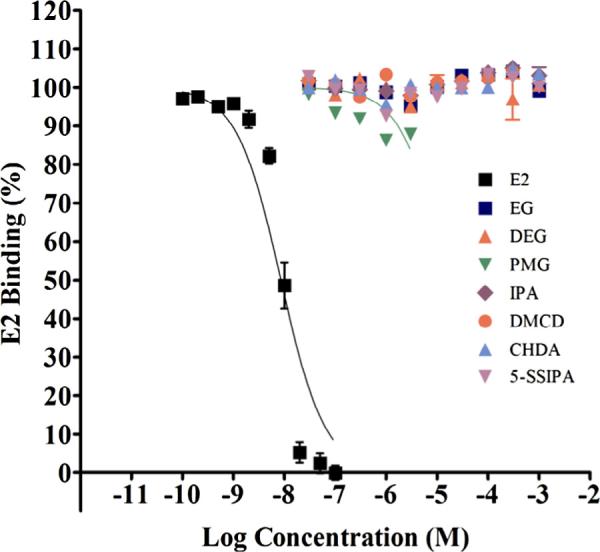
ER alpha binding of the monomers with reference control E2. Competitive binding curves of the strong positive reference control, E2, and monomers against ER receptor (ER Alpha). Increasing concentrations of E2 and monomers were incubated with full length ER-alpha and Fluormone™ at RT for approximately 2 hours followed by measurement of fluorescence polarization. Polarization data were converted to percent inhibition and plotted against logM concentration. Data points representing two independent assays each with three replicates/exposure concentration were combined and plotted together as one competitive binding curve (Mean ± StDev, average of six replicates).
Fig. 3.
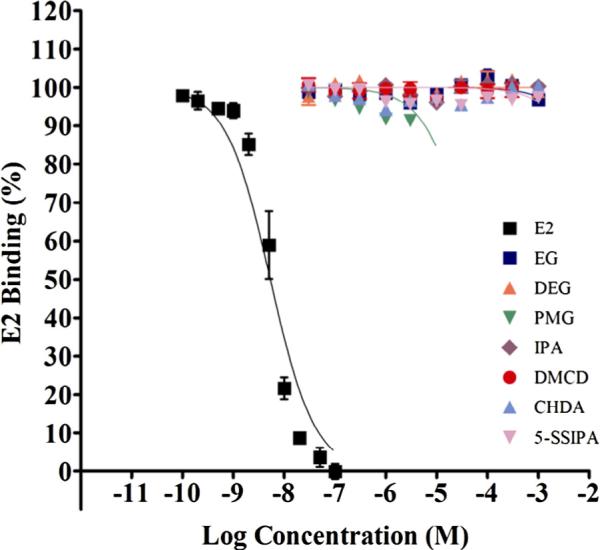
ER beta binding of the monomers with reference control E2. Competitive binding curves of the strong positive reference control, E2 and monomers against ER receptor (ER Beta). Increasing concentrations of E2 and monomers were incubated with full length ER-beta and Fluormone™ at RT for approximately 2 hours followed by measurement of fluorescence polarization. Polarization data were converted to percent inhibition and plotted against logM concentration. Data points representing two independent assays each with three replicates/exposure concentration were combined and plotted together as one competitive binding curve (Mean ± StDev, average of six replicates).
3.4. In Vitro androgen receptor transactivation assay in human cells
The stability and performance of the MDA-kb2 cell line was monitored by use of the following reference chemicals: strong positive agonist, negative antagonist, DHT; strong positive antagonist, negative agonist, nilutamide; and the weak positive antagonist, negative agonist, 4-nonylphenol. A complete concentration response curve for each reference compound was run each time the transcriptional activation assay was performed and compared to historical data (see supplementary materials). The results indicate no agonism or antagonism for any of the monomers.
PMG demonstrated a significant decrease in % DHT control response for all exposure concentrations with no significant differences between the low and high concentrations of DHT (1 nM and 1 μM, respectively). This indicated that this was not an AR-specific response and cytotoxicity was identified for all exposure concentrations. The PMG assay was therefore not compatible with the testing platform due to severe cytotoxicity (see supplementary materials).
Figures 4, 5 and 6 show data from all monomers (agonism), ethylene glycol and related monomers (antagonism) and terephthalic acid related monomers (antagonism), respectively.
Fig. 4.
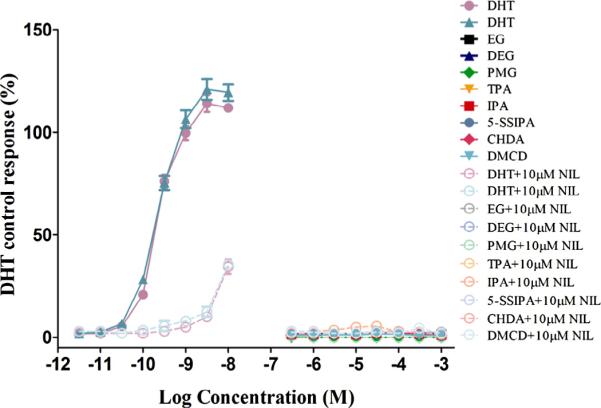
AR transactivation of the monomers with reference control DHT (Agonism). Dose–response curves for strong positive agonist reference control, DHT and monomers. MDA-kb2 cells were grown for approximately 24 hours prior to exposure to test article or reference control. Exposure time was approximately 24 hours. Each 96-well plate included several control groups: vehicle control (0.5% DMS0, 12 replicates/plate) and maximal response agonist control (10 nM DHT, six replicates/ plate). Additionally, all exposure concentrations of reference controls and monomers were tested as six replicates/plate and co-exposure of 10 mM NIL at each concentration as two replicates/plate. Stability of the cell line was monitored by running complete concentration response curves for the strong AR agonist, DHT and comparing to historical data. None of the monomers showed AR agonism. Data shown for monomers are the Mean ± StDev of one representative independent run of the transactivation assay. PMG was cytotoxic at all exposure concentrations greater than −6.0 logM. Data for both independent runs of the reference control, DHT are shown.
Fig. 5.
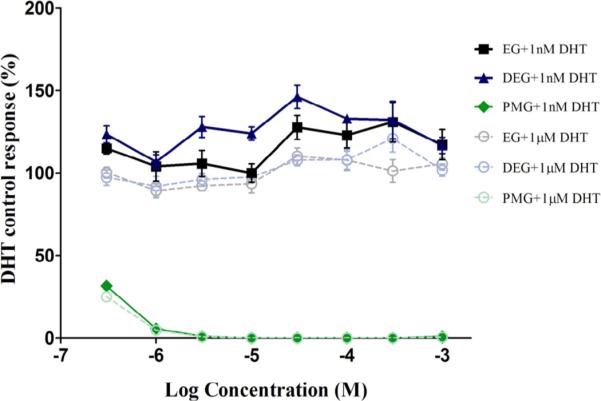
AR transactivation of ethylene glycol and related monomers (Antagonism). Dose–response curves for Ethylene Glycol and related monomers in the presence of high concentrations (1000 nM) and low concentrations (1 nM) of DHT are plotted. Each exposure concentration is a replicate of four/plate/condition. MDA-kb2 cells were grown for approximately 24 hours prior exposure to test article or reference control. Exposure time was approximately 24 hours. Each 96-well plate included several control groups: vehicle control (0.5% DMSO, N = 12 replicates/plate), maximal response agonist control (10 nM DHT, N = 6 replicates/plate). None of the monomers showed AR antagonism. PMG showed significant decrease in signal at both high and low concentrations of DHT, 1000 nM and 1 nM, respectively due to cytotoxicity present at all exposure concentrations. Data shown are the Mean ± StDev of one representative independent run of the transactivation assay.
Fig. 6.
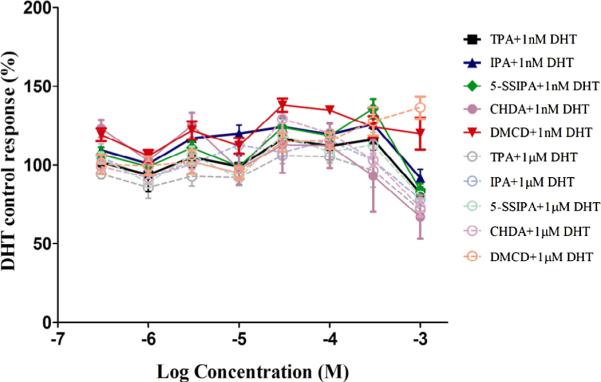
AR transactivation of terephthalic acid related monomers (Antagonism). Dose– response curves for Terephthalic Acid related monomers in the presence of high concentrations (1000 nM) and low concentrations (1 nM) of DHT are plotted. Each exposure concentration is a replicate of four/plate/condition. MDA-kb2 cells were grown for approximately 24 hours prior to exposure to test article or reference control. Exposure time was approximately 24 hours. Each 96-well plate included several control groups: vehicle control (0.5% DMSO, N = 12 replicates/plate), maximal response agonist control (10 nM DHT, N = 6 replicates/plate). None of the Terephthalic acid related monomers showed AR antagonism. PMG demonstrated cytotoxicity at all concentrations greater than −6.0 logM. Data shown are the Mean ± StDev of one representative independent run of the transactivation assay.
3.5. In Vitro estrogen receptor transactivation assay in human cells
The results indicate no agonism or antagonism for any of the monomers. The stability and performance of the T47D-KBluc cell line was monitored by use of the following reference chemicals: strong positive agonist, negative antagonist, E2; strong positive antagonist, negative agonist, ICI 182,780; and the weak positive agonist, negative antagonist, methoxychlor (see supplementary materials). A complete concentration response curve for each reference compound was run each time the transcriptional activation assay was performed and compared to historical data. Figures 7, 8 and 9 show data from all monomers (agonism) ethylene glycol and related monomers (antagonism) and terephthalic acid related monomers (antagonism), respectively.
Fig. 7.
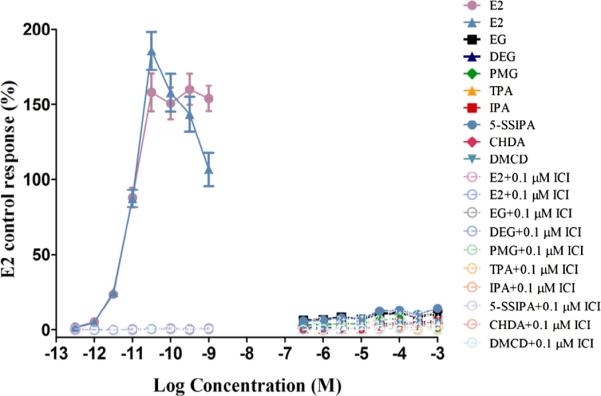
ER transactivation of the monomers with reference control E2 (Agonism). Dose–response curves for reference control E2, and monomers. T47D-KBluc cells were grown for approximately 24 hours prior to exposure to test article or reference control. Exposure time was approximately 24 hours. Each 96-well plate included several control groups: vehicle control (0.5% DMS0, 12 replicates/plate) and maximal response agonist control (0.1 nM E2, six replicates/plate). Additionally, all exposure concentrations of reference controls and monomers were tested in replicates of six/plate and 1 mM ICI 182,780 co-exposure at each concentration as two replicates/plate. None of the monomers showed ER agonism. Stability of the cell line was monitored by running complete concentration response curves for the strong ER agonist, E2 and the weak agonist, methoxychlor and comparing to historical data. Data shown are the Mean ± StDev of one representative independent run of the transactivation assay.
Fig. 8.
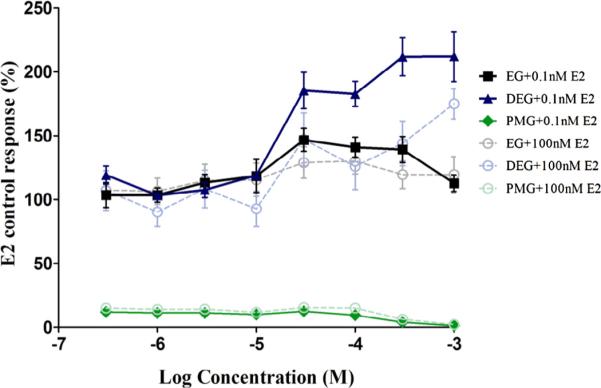
ER transactivation of ethylene glycol and related monomers (Antagonism). Dose–response curves for Ethylene Glycol related monomers in the presence of high concentrations (100 nM) and low concentrations (0.1 nM) of E2 are plotted. Each exposure concentration is replicates of four/plate/condition. T47D-KBluc cells were grown for approximately 24 hours prior to exposure to test article or reference control. Exposure time was approximately 24 hours. Each 96-well plate included several control groups: vehicle control (0.5% DMSO, 12 replicates/plate), maximal response agonist control (10 nM DHT, six replicates/plate). None of the Ethylene Glycol related monomers showed ER antagonism. Data shown are the Mean ± StDev of one representative independent run of the transactivation assay.
Fig. 9.
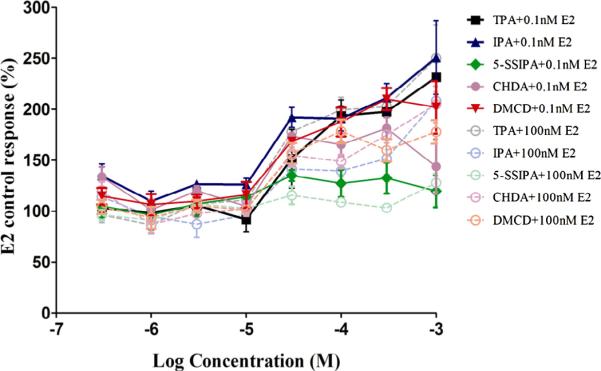
ER transactivation of terephthalic acid related monomers (Antagonism). Dose–response curves for Terephthalic Acid and related monomers in the presence of high concentrations (100 nM) and low concentrations (0.1 nM) of E2 are plotted. Each exposure concentration is replicates of four/plate/condition. T47D-KBluc cells were grown for approximately 24 hours prior to exposure to test article or reference control. Exposure time was approximately 24 hours. Each 96-well plate included several control groups: vehicle control (0.5% DMSO, 12 replicates/plate), maximal response agonist control (10 nM DHT, six replicates/plate). None of the Terephthalic Acid related monomers showed ER antagonism. Data shown are the Mean ± StDev of one representative independent run of the transactivation assay.
4. Discussion
A battery of well-recognized and validated studies using QSAR predictive models, in vitro receptor binding assays, and transactivation assays was conducted on several monomers to characterize their potential androgenicity and estrogenicity. The screening assays were chosen to provide information about the potential of a chemical to interact with endocrine systems (USEPA, 2008). AR, ER-alpha and ER-beta fluorescence polarization assays did not show any significant displacement of the Fluormone, except EG in the AR binding assay. The AR binding curve for EG was equivocal; however, the displacement was not dose dependent as would be found in a true binding response and therefore might be due to an artifact in the test system. PMG was identified as incompatible with the AR and ER transactivation assays (agonism and antagonism) as all concentrations of PMG tested were cytotoxic. ER transactivation (antagonism) assays demonstrated responses for DEG, TPA, IPA, CHDA and 5-SSIPA that were significantly higher than the low concentration of E2, 0.1 nM (more than 100% of E2 control response). In the literature this has been referred to as a supramaximal (SPMX) response; however, the mechanism has remained elusive (Montano et al., 2010). Overall, the present results show no evidence of interaction of any of the tested monomers with these systems.
The lack of endocrine effects of EG and DEG is consistent with the findings of Nishihara et al. in which no response was noted to EG or DEG in a yeast two-hybrid system dependent upon interaction with an ER alpha receptor (Nishihara et al., 2000). With respect to EG, one report demonstrated the induction of the vitellogenin gene in rainbow trout (Ren et al., 1996). Subsequent to publication, one of the coauthors stated that the effects observed with EG only occurred at high doses (i.e., 1–20 g/kg range) with a presently unknown mechanism and that the estrogenic potential had not been studied by appropriate in vivo methods. As pointed out by Lech, “We suggest that it is inappropriate to include DMFA (dimethyl formamide) and EG on lists of endocrine disrupters since the relationship of the vitellogenin mRNA induction we observed could be unrelated to endocrine activity of these materials and occurred only at very high doses” (Lech, 1997). Moreover, a more recent report showed that EG had no estrogenic or antiestrogenic activity in an in vitro MVLN cell-based transcription assay (Freyberger and Schmuck, 2005).
The results of the screening assays are insufficient to conclude that the tested chemical is, or is not, an endocrine disruptor. Evaluations in whole animals are needed to determine if endocrine disruption and the accompanying adverse effects are occurring. Determining whether a chemical causes endocrine-mediated adverse effects requires the use of a customized combination of tests in which carefully selected biological endpoints are assessed. Generally, tests are longer-term studies designed to encompass critical life stages and processes, a broad range of doses, and dosing by relevant routes. For mammals, these usually include two generations of daily dosing with the chemical. Effects on fertility and mating, embryonic development, neonatal growth and development, and sexual maturation from the juvenile to sexual maturity are assessed.
In addition to the data reported here, with the exception of PMG each of the monomers has been evaluated in various in vivo assays that provide, in addition to identifying other target organs and systems, also insight into endocrine-related endpoints. At a minimum this includes a developmental toxicology study and a subchronic (13 weeks or longer) general toxicology study. Table 2 summarizes these studies. No evidence of toxicity to reproductive organs was observed with any of the monomers in studies that assessed systemic toxicity following oral exposures of 13 weeks duration or longer. In addition, no evidence of developmental toxicity was observed. Although the studies do not constitute a comprehensive set of studies to assess potential endocrine effects, they nonetheless provide additional evidence that these compounds do not possess androgenic or estrogenic activity in vivo.
Table 2.
Availability of animal toxicology data for the monomers.
| EG | DEG | TPA | IPA | 5-SS1PA | DMCD | CHDA | |
|---|---|---|---|---|---|---|---|
| General Toxicology | |||||||
| Chronic (1 year - rats and mice)a | rat: NOAEL 150, LOAEL 300 mg/kg/day (kidney) (OECD, 2004b) | ||||||
| Subchronic (13-15 weeks - rats) | NOEL 600-1000, LOEL 1200-2000 mg/kg/day (kidney)b (OECD, 2004b) | 90-day drinking water study: NOEL >200 mg/kg/day (OECD, 2004a) | 15-week feeding study: NOAEL 1220 mg/kg/day (males), 1456 (females) (bladder) (OECD, 2001) | 13-week feeding study: NOAEL 250, LOAEL 800 mg/kg/day (crystalluria, renal pathology) (OECD, 2002) | **** | * | 90-day gavage: NOEL 100, NOAEL 300 mg/kg/day (reduced uterus weights) (USEPA, 2003) |
| Developmental Toxicity | |||||||
| Developmental toxicity (rats) | diet: NOEL 400, LOEL 1000 (poor ossification), maternal NOEL >1000 mg/kg/day (OECD, 2004b)c | gavage: NOEL 1118, LOEL 4472 mg/kg/day (reduced pup weights); maternal NOEL 1118, LOEL 4472 (OECD, 2004a) | no maternal or developmental toxicity at up to 10 mg/m3,days 6-15 of pregnancy (OECD, 2001) | 4-week inhalation study: no maternal or developmental toxicity at up to 10 mg/m3, days 6-15 of pregnancy (OECD, 2002) | **** | ||
| Developmental toxicity (rabbits) | gavage: NOAEL >2000 (OECD, 2004b)c | gavage: maternal and fetal NOEL >1000 mg/kg/day (OECD, 2004a) | |||||
| Developmental toxicity (mice) | gavage: NOEL 150, LOEL 500 (reduced pup weights), maternal NOEL >1500 mg/kg/day (OECD, 2004b)c | ||||||
| Developmental and reproductive screen (rats) | parental toxicity NOAEL 888 mg/kg (males), 1124 (females); no effects on reproductive capacity: NOAEL 888 (males), 1124 (females)c (USEPA, 1981) | ** | |||||
| Reproductive Toxicity | |||||||
| Fertility assessment by continuous breeding (mice) | drinking water study: parental NOAEL 3060, LOEL 6130 mg/kg/day (significantly reduced number of litters, live pup weight); F1 NOAEL 3060, LOEL 6130 (poor postnatal survival, craniofacial malformations including exencephaly, cleft palate) (OECD, 2004a) | ||||||
| Two generation reproductive toxicity (rats) | reproductive toxicity and parental NOEL >1000 mg/kg/day (OECD, 2004b) | gavage: no reproductive-/embryotoxicity at 2200 mg/kg/day (ECHA, 2011a) | NOAEL 2010.9-2324.3 mg/kg/day (highest dose used in study) (ECHA, 2011b) | *** | **** | ||
| Three generation reproductive toxicity (mice and rats) | rats: no effect when exposed to 40, 200, or 1000 mg/kg/dayin feed for 3 generations (OEHHA) | ||||||
Data from CHDA apply.
Data from DMCD apply (CHDM data, as reported in Osimitz et al. (2012) also apply).
Data from TPA apply.
Data from IPA and TPA apply.
Mouse: OECD dossier only lists 2-year studies.
There is also a 16-week feeding study in rats: NOEL 150, LOEL 500 mg/kg/day (kidney).
DMCD (mixed isomers); CAS No.: 94-60-0, purity was 93.2%.
Moreover, some of the monomers have metabolic relationships that permit the bridging between some of the molecules. Figure 10 illustrates the metabolic connectedness of CHDM (reported in Osimitz et al., 2012) to DMCD and to CHDA. CHDM has also been studied extensively, including the use of the Hershberger assay for androgenicity and the uterotrophic assay for estrogenicity. These assays showed no evidence of endocrine activity. This is in contrast to a recent report that “degradation products” of CHDM showed estrogenic activity in the MCF-7 cell proliferation assay (Yang et al., 2011). The actual degradation products are not specified, nor are the data suggesting estrogenicity shown in their report. However, CHDA is the primary metabolite of CHDM in rats (DiVincenzo and Ziegler, 1980) and our data show that CHDA has no endocrine activity in any of the assays performed. DMCD is considered to be an acceptable surrogate for CHDA. Although no data exist specifically for DMCD, it has been demonstrated that the enzymatic cleavage of short to medium length alkyl chain esters is located in the one and four positions on similar compounds. Specifically, the methyl units of 1,4-benzenedicarboxylic acid, dimethyl ester (dimethylterephthalate; DMT) and the ethylhexyl moieties of 1,4-benzenedicarboxylic acid, bis(2-ethylhexyl) ester are readily removed to form 1,4-benzenedicarboxylic acid (terephthalic acid; TPA) (Barber et al., 1994; Heck and Kluwe, 1980).
Fig. 10.

Metabolic relationship between CHDM, DMCD, and CHDA. This figure illustrates the metabolic connectedness of CHDM to DMCD and to CHDA.
Figure 11 shows the relationship between DMT and TPA, IPA, and 5-SSIPA. Both the Hershberger and uterotrophic assays have been performed on DMT with no evidence of endocrine-related activity. These results differ from those in a recent report that “degradation products” of DMT showed estrogenic activity in the MCF-7 cell proliferation assay (Yang et al., 2011). Once again, the actual degradation products are unspecified and data supporting their estrogenicity are lacking. However, as mentioned above, TPA is the primary metabolite of DMT (Heck and Kluwe, 1980; Moffitt et al., 1975) and our study shows that DMT has no endocrine activity in any of the assays performed. TPA also showed no evidence of estrogenic activity in a two-generation reproduction study (Ball et al., 2012).
Fig. 11.

Monomers based on Phthalic acid – relationship between DMT and TPA, IPA, and SSIPA. This figure shows the relationship between DMT and TPA, IPA, and 5-SSIPA.
5. Conclusions
The AR and ER binding assays conducted on several monomers individually showed no evidence of interaction with either the AR or the alpha or beta ER. Similarly, the AR and ER transactivation assays conducted with human cells were negative. Moreover, most of the monomers have been subjected to 13-week subchronic toxicity studies and developmental toxicity studies in rats with no androgenor estrogen-related effects being noted. Given the negative results of the in vitro screening assays that were conducted on these monomers, as well as repeated dose, developmental, and reproductive studies available for them, the data suggest that ethylene glycol (EG; CASRN 107-21-1), diethylene glycol (DEG; CASRN 111-46-6), isophthalic acid (IPA; CASRN 121-91-5), monosodium-5-sulfoisophthalic acid (5-SSIPA; CASRN 6362-79-4), terephthalic acid (TPA; CASRN 100-21-0), 1,4-cyclohexanedicarboxylic acid (CHDA; CASRN 1076-97-7), and dimethylcyclohexanedicarboxylate (DMCD; CASRN 94-60-0) do not exhibit androgenic or estrogenic activity and that, as such, longer term studies are not necessarily indicated for these monomers. These results are similar to our recent findings from a similar battery of assessments on dimethyl terephthalate (DMT), 1,4-cyclohexanediemethanol (CHDM), and 2,2,4,4-tetramethyl-1, 3-cyclobutanediol (TMCD) (Osimitz et al., 2012).
Supplementary Material
Acknowledgements
James Deyo and Emmett O'Brien of Eastman Chemical provided input to the design of the studies conducted and offered comments to drafts of the manuscript. Wiebke Droege of Science Strategies, LLC aided in editing, proof reading, and preparation of the manuscript for submission.
Role of funding source
Eastman Chemical Company (Grant# N/A) funded the studies described in this manuscript. They commissioned the work and reviewed and approved the protocols. The studies were conducted by independent researchers at the various institutions with which the authors are affiliated. The authors independently interpreted the results from all studies. It was the decision of Eastman Chemical Company to publish the data and Eastman Chemical Company provided a review of the manuscript, but did not alter the corresponding author's conclusions.
Abbreviations
- A
agonist
- ANN
Artificial Neural Network
- AR
androgen receptor
- CART
Classification and Regression Tree
- CASRN
Chemical Abstracts Service Registry Number
- CHDA
1,4-cyclohexanedicarboxylic acid
- CHDM
1,4-cyclohexanedimethanol
- DEG
diethylene glycol
- DHT
dihydrotestosterone
- DMCD
cis and trans dimethylcyclohexanedicarboxylate
- DMSO
dimethyl sulfoxide
- DMT
dimethyl terephthalate
- E2
17β-estradiol
- ECHA
European Chemicals Agency
- EDSP
Endocrine Disruption Screening Program
- EDSTAC
Endocrine Disruptor Screening and Testing Advisory Committee
- EG
ethylene glycol
- EFSA
European Food Safety Authority
- ER
estrogen receptor
- GR
glucocorticoid receptor
- mP
milli-polarization
- HPV
High Production Volume
- IPA
isophthalic acid
- LBD
ligand binding domain
- MVLN
MCF-7-derived cell line
- MOE
Molecular Operating Environment
- N
number
- NIL
nilutamide
- NRC
National Research Council
- OECD
Organisation for Economic Co-operation and Development
- PI
propidium iodide
- OEHHA
California Office of Environmental Health Hazard Assessment
- PMG
polytetramethylene glycol
- QSAR
Quantitative Structure–Activity Relationship
- RBA
relative binding affinity
- 5-SSIPA
monosodium-5- sulfoisophthalic acid
- SPMX
supramaximal response
- SVM
Support Vector Machine
- TMCD
2,2,4,4-tetramethyl-1, 3-cyclobutanediol
- TPA
terephthalic acid
- TSCA
Toxic Substances Control Act
- USEPA
United States Environmental Protection Agency
- USFDA
United States Food and Drug Administration
Footnotes
Conflict of interest
The authors declare that all work pertaining to this effort was supported financially by Eastman Chemical.
Transparency document
The Transparency document associated with this article can be found in the online version.
Appendix: Supplementary material
Supplementary data to this article can be found online at doi:10.1016/j.fct.2014.10.015.
References
- Ball GL, McLellan CJ, Bhat VS. Toxicological review and oral risk assessment of terephthalic acid (TPA) and its esters: a category approach. Crit. Rev. Toxicol. 2012;42:28–67. doi: 10.3109/10408444.2011.623149. [DOI] [PubMed] [Google Scholar]
- Barber ED, Fox JA, Giordano CJ. Hydrolysis, absorption and metabolism of di(2-ethylhexyl) terephthalate in the rat. Xenobiotica. 1994;24:441–450. doi: 10.3109/00498259409043247. [DOI] [PubMed] [Google Scholar]
- Casals-Casas C, Desvergne B. Endocrine disruptors: from endocrine to metabolic disruption. Annu. Rev. Physiol. 2011;73:135–162. doi: 10.1146/annurev-physiol-012110-142200. [DOI] [PubMed] [Google Scholar]
- Chung BY, Kyung M, Lim SK, Choi SM, Lim DS, Kwack SJ, et al. Uterotrophic and Hershberger assays for endocrine disruption properties of plastic food contact materials polypropylene (PP) and polyethylene terephthalate (PET). J. Toxicol. Environ. Health A. 2013;76:624–634. doi: 10.1080/15287394.2013.801767. [DOI] [PubMed] [Google Scholar]
- DeLisle RK, Yu SJ, Nair AC, Welsh WJ. Homology modeling of the estrogen receptor subtype beta (ER-beta) and calculation of ligand binding affinities. J. Mol. Graph. Model. 2001;20:155–167. doi: 10.1016/s1093-3263(01)00115-2. [DOI] [PubMed] [Google Scholar]
- Dengler WA, Schulte J, Berger DP, Mertelsmann R, Fiebig HH. Development of a propidium iodide fluorescence assay for proliferation and cytotoxicity assays. Anticancer Drugs. 1995;6:522–532. doi: 10.1097/00001813-199508000-00005. [DOI] [PubMed] [Google Scholar]
- Diamanti-Kandarakis E, Bourguignon JP, Giudice LC, Hauser R, Prins GS, Soto AM, et al. Endocrine-disrupting chemicals: an Endocrine Society scientific statement. Endocr. Rev. 2009;30:293–342. doi: 10.1210/er.2009-0002. [DOI] [PMC free article] [PubMed] [Google Scholar]
- DiVincenzo GD, Ziegler DA. Metabolic fate of 1,4-cyclo[14C] hexanedimethanol in rats. Toxicol. Appl. Pharmacol. 1980;52:10–15. doi: 10.1016/0041-008x(80)90241-0. [DOI] [PubMed] [Google Scholar]
- ECHA [14.08.01];Registration dossier: 2,2’-oxydiethanol. Exp Supporting Toxicity to reproduction.001. Last modified June 30, 2014. 2011a Available from: http://echa.europa.eu.
- ECHA [14.08.01];Registration dossier: terephthalic acid. Exp Key Toxicity to reproduction.001. Last modified June 30, 2014. 2011b Available from: < http://echa.europa.eu>.
- Freyberger A, Schmuck G. Screening for estrogenicity and anti-estrogenicity: a critical evaluation of an MVLN cell-based transactivation assay. Toxicol. Lett. 2005;155:1–13. doi: 10.1016/j.toxlet.2004.06.014. [DOI] [PubMed] [Google Scholar]
- Guart A, Wagner M, Mezquida A, Lacorte S, Oehlmann J, Borrell A. Migration of plasticisers from Tritan and polycarbonate bottles and toxicological evaluation. Food Chem. 2013;141:373–380. doi: 10.1016/j.foodchem.2013.02.129. [DOI] [PubMed] [Google Scholar]
- Halden RU. Plastics and health risks. Annu. Rev. Public Health. 2010;31:179–194. doi: 10.1146/annurev.publhealth.012809.103714. [DOI] [PubMed] [Google Scholar]
- Heck HA, Kluwe CL. Microanalysis of urinary electrolytes and metabolites in rats ingesting dimethyl terephthalate. J. Anal. Toxicol. 1980;4:222–226. doi: 10.1093/jat/4.5.222. [DOI] [PubMed] [Google Scholar]
- Lech J. Two solvents, dimethyl formamide (DMFA) and ethylene glycol (EG), induced the mRNA of vitellogenin in rainbow trout. Chem. Biol. Interact. 1997;108:135. doi: 10.1016/s0009-2797(97)00093-8. [DOI] [PubMed] [Google Scholar]
- Meek PJ, Liu Z, Tian L, Wang CY, Welsh WJ, Zauhar RJ. Shape Signatures: speeding up computer aided drug discovery. Drug Discov. Today. 2006;11:895–904. doi: 10.1016/j.drudis.2006.08.014. [DOI] [PubMed] [Google Scholar]
- Moffitt AE, Jr., Clary JJ, Lewis TR, Blanck MD, Perone VB. Absorption, distribution and excretion of terephthalic acid and dimethyl terephthalate. Am. Ind. Hyg. Assoc. J. 1975;36:633–641. doi: 10.1080/0002889758507303. [DOI] [PubMed] [Google Scholar]
- Montano M, Bakker EJ, Murk AJ. Meta-analysis of supramaximal effects in in vitro estrogenicity assays. Toxicol. Sci. 2010;115:462–474. doi: 10.1093/toxsci/kfq056. [DOI] [PubMed] [Google Scholar]
- Muncke J. Endocrine disrupting chemicals and other substances of concern in food contact materials: an updated review of exposure, effect and risk assessment. J. Steroid Biochem. Mol. Biol. 2011;127:118–127. doi: 10.1016/j.jsbmb.2010.10.004. [DOI] [PubMed] [Google Scholar]
- Nishihara T, Nishikawa J, Kanayama T, Dakeyama F, Saito K, Imagawa M, et al. Estrogenic activities of 517 chemicals by yeast two-hybrid assay. J. Health Sci. 2000;46:282–298. [Google Scholar]
- OECD [14.08.01];SIDS Initial Assessment Report for 12th SIAM: Terephthalic Acid (TPA) 2001 Available from: < http://www.inchem.org/documents/sids/sids/100-21-0.pdf>.
- OECD [14.08.01];SIDS Initial Assessment Report for 14th SIAM: Isophthalic acid. 2002 Available from: < http://webnet.oecd.org/Hpv/UI/SIDS_Details.aspx?id=091D53AA-29E0-4EC2-A597-02FE34824C59>.
- OECD [14.08.01];OECD Existing Chemicals Database: SIDS Dossier on the HPV Chemical Diethylene Glycol. Revised Submission: January 26, 2007. 2004a Available from: < http://webnet.oecd.org/Hpv/UI/SIDS_Details.aspx?id=AACF6F16-58AA-4801-AC76-4437E9B62ED4>.
- OECD [14.08.01];OECD Existing Chemicals Database: SIDS Dossier on the HPV Chemical Ethylene Glycol. Revised Submission: January 26, 2007. 2004b Available from: < http://webnet.oecd.org/Hpv/UI/SIDS_Details.aspx?id=AACF6F16-58AA-4801-AC76-4437E9B62ED4>.
- OEHHA [14.08.01];Chronic Toxicology Summary Ethylene Glycol. Available from: < http://oehha.ca.gov/air/chronic_rels/pdf/107211.pdf>.
- Ohashi A, Kotera H, Hori H, Hibiya M, Watanabe K, Murakami K, et al. Evaluation of endocrine disrupting activity of plasticizers in polyvinyl chloride tubes by estrogen receptor alpha binding assay. J. Artif. Organs. 2005;8:252–256. doi: 10.1007/s10047-005-0307-y. [DOI] [PubMed] [Google Scholar]
- Ohno K, Azuma Y, Nakano S, Kobayashi T, Hirano S, Nobuhara Y, et al. Assessment of styrene oligomers eluted from polystyrene-made food containers for estrogenic effects in in vitro assays. Food Chem. Toxicol. 2001;39:1233–1241. doi: 10.1016/s0278-6915(01)00071-0. [DOI] [PubMed] [Google Scholar]
- Ohno K, Azuma Y, Date K, Nakano S, Kobayashi T, Nagao Y, et al. Evaluation of styrene oligomers eluted from polystyrene for estrogenicity in estrogen receptor binding assay, reporter gene assay, and uterotrophic assay. Food Chem. Toxicol. 2003;41:131–141. doi: 10.1016/s0278-6915(02)00211-9. [DOI] [PubMed] [Google Scholar]
- Osimitz TG, Eldridge ML, Sloter E, Welsh W, Ai N, Sayler GS, et al. Lack of androgenicity and estrogenicity of the three monomers used in Eastman's Tritan copolyesters. Food Chem. Toxicol. 2012;50:2196–2205. doi: 10.1016/j.fct.2012.02.010. [DOI] [PubMed] [Google Scholar]
- Ren L, Meldahl A, Lech JJ. Dimethyl formamide (DMFA) and ethylene glycol (EG) are estrogenic in rainbow trout. Chem. Biol. Interact. 1996;102:63–67. doi: 10.1016/0009-2797(96)03727-1. [DOI] [PubMed] [Google Scholar]
- Talsness CE, Andrade AJ, Kuriyama SN, Taylor JA, vom Saal FS. Components of plastic: experimental studies in animals and relevance for human health. Philos. Trans. R. Soc. Lond. B. Biol Sci. 2009;364:2079–2096. doi: 10.1098/rstb.2008.0281. [DOI] [PMC free article] [PubMed] [Google Scholar]
- USEPA. High Production Volume Information System (HPVIS) 1,4-Cyclohexanedicarboxylic acid, dimethyl ester. Endpoint Developmental Toxicity/Teratogenicity. Reference: Reproduction/Developmental Toxicity Screening Test in the Rat. Toxicological Sciences Laboratory; Health and Environment Laboratories, Eastman Kodak Company; Rochester, NY.: 2003. [14.08.01]. Available from: < http://www.epa.gov/chemrtk/hpvis/index.html>. [Google Scholar]
- USEPA, High Production Volume Information System (HPVIS) 1,4-Cyclohexanedicarboxylic acid. Endpoint Repeated-Dose Toxicity. Reference:,4-Cyclohexanedicarboxylic Acid (1,4-CHDA): 13-Week Oral Toxicity (Gavage) Study in Wistar Rats. RCC Ltd.; Itingen, Switzerland: [14.08.01]. RCC Study Number: A20531. 1981. Available from: < http://www.epa.gov/chemrtk/hpvis/index.html>. [Google Scholar]
- USEPA . Technical Review Document for the Endocrine Disruptor Screening Program (EDSP): Proposed Tier 1 Screening Battery. U.S. Environmental Protection Agency, Office of Prevention, Pesticides, and Toxic Substances, Office of Science Coordination and Policy; Washington, DC 20460: 2008. [14.08.01]. Available from: < www.epa.gov/scipoly/sap/meetings/2008/march/technical_review.pdf>. [Google Scholar]
- Verdonk ML, Cole JC, Hartshorn MJ, Murray CW, Taylor RD. Improved protein-ligand docking using GOLD. Proteins. 2003;52:609–623. doi: 10.1002/prot.10465. [DOI] [PubMed] [Google Scholar]
- Vinggaard AM, Niemela J, Wedebye EB, Jensen GE. Screening of 397 chemicals and development of a quantitative structure-activity relationship model for androgen receptor antagonism. Chem. Res. Toxicol. 2008;21:813–823. doi: 10.1021/tx7002382. [DOI] [PubMed] [Google Scholar]
- Wagner M, Oehlmann J. Endocrine disruptors in bottled mineral water: total estrogenic burden and migration from plastic bottles. Environ. Sci. Pollut. Res. Int. 2009;16:278–286. doi: 10.1007/s11356-009-0107-7. [DOI] [PubMed] [Google Scholar]
- Wilson VS, Bobseine K, Lambright CR, Gray LE., Jr. A novel cell line, MDA-kb2, that stably expresses an androgen- and glucocorticoid-responsive reporter for the detection of hormone receptor agonists and antagonists. Toxicol. Sci. 2002;66:69–81. doi: 10.1093/toxsci/66.1.69. [DOI] [PubMed] [Google Scholar]
- Wilson VS, Bobseine K, Gray LE., Jr. Development and characterization of a cell line that stably expresses an estrogen-responsive luciferase reporter for the detection of estrogen receptor agonist and antagonists. Toxicol. Sci. 2004;81:69–77. doi: 10.1093/toxsci/kfh180. [DOI] [PubMed] [Google Scholar]
- Yang CZ, Yaniger SI, Jordan VC, Klein DJ, Bittner GD. Most plastic products release estrogenic chemicals: a potential health problem that can be solved. Environ. Health Perspect. 2011;119:989–996. doi: 10.1289/ehp.1003220. [DOI] [PMC free article] [PubMed] [Google Scholar]
- Zauhar RJ, Moyna G, Tian L, Li Z, Welsh WJ. Shape signatures: a new approach to computer-aided ligand- and receptor-based drug design. J. Med. Chem. 2003;46:5674–5690. doi: 10.1021/jm030242k. [DOI] [PubMed] [Google Scholar]
Associated Data
This section collects any data citations, data availability statements, or supplementary materials included in this article.